
You finally have a website.
You’ve spent hours choosing the right design, creating helpful content, building landing pages, and figuring out how to attract visitors.
Maybe you’ve even started promoting your website through social media, email marketing, traffic exchanges, or paid advertising.
Then something exciting happens.
People start visiting your website.
But that excitement quickly leads to a few important questions.
Where are these visitors coming from? Which pages are they looking at? Are they actually interested in what you’re offering? And perhaps most importantly, are any of those visitors becoming subscribers, leads, or customers?
Without answers, you’re essentially marketing your business with your eyes closed.
That’s why learning how to track website traffic is one of the most valuable skills you can develop as an online business owner.
And here’s something beginners often overlook:
Getting more visitors doesn’t automatically mean you’re getting better results.
A website attracting 100 genuinely interested visitors could potentially generate more leads than one receiving 1,000 visitors who leave without taking action.
The difference comes down to understanding your traffic, measuring meaningful actions, and using that information to make smarter decisions.
Fortunately, you don’t need to be a data analyst, learn complicated coding, or spend hundreds of dollars on expensive software to get started.
Free tools like Google Analytics 4 and Google Search Console can help you understand how people discover your website, where your visitors come from, and what happens after they arrive.
In this beginner-friendly guide, you’ll learn how to:
- Track website visitors and understand where your traffic originates.
- Use Google Analytics 4 to explore website activity and visitor behavior.
- Understand Google Search Console and the information it provides.
- Identify meaningful conversions, including leads, signups, and purchases.
- Measure whether your marketing efforts are producing useful results.
- Avoid common tracking mistakes that can lead to misleading conclusions.
- Build a simple weekly tracking routine without getting overwhelmed.
Whether you’re launching your first website, growing an affiliate marketing business, or trying to improve an existing online business, the goal is the same.
Stop guessing about your website’s performance and start making decisions based on useful information.
Let’s begin by understanding what website traffic tracking actually means.
What Is Website Traffic Tracking?
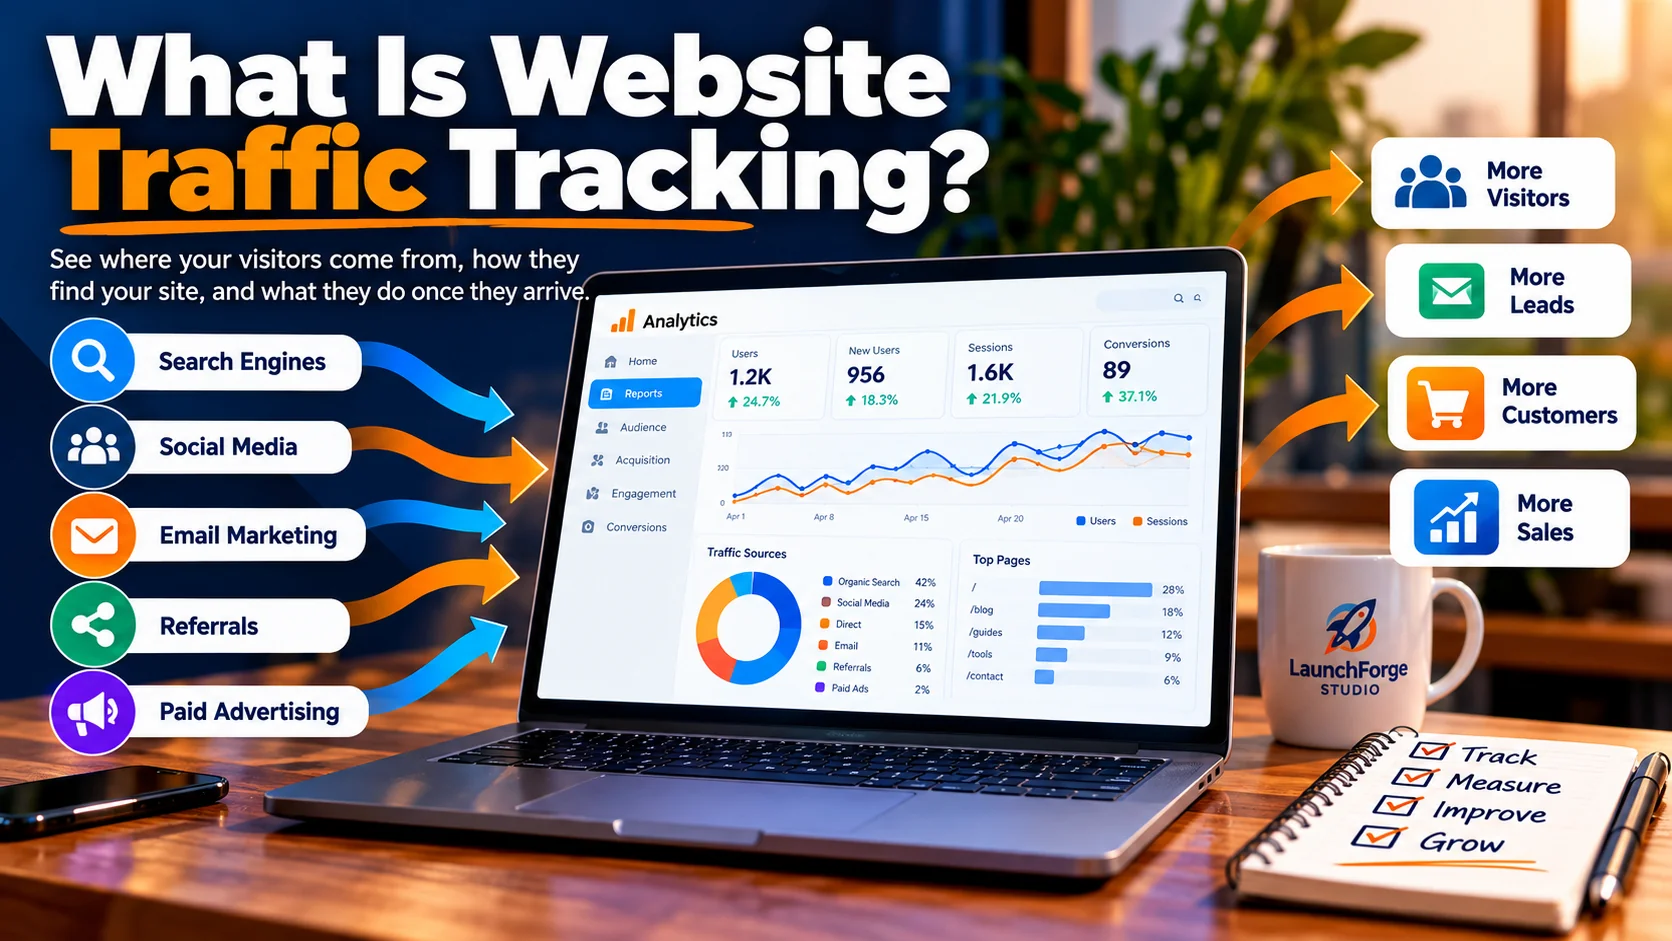
Discover where your website visitors come from, how they interact with your content, and which traffic sources contribute to your business goals.
Website traffic tracking is the process of collecting and analyzing information about the people who visit your website, how they find it, and what they do once they arrive.
In simple terms, it helps answer three important questions:
- Who is visiting your website? How many people are arriving, and are they new or returning visitors?
- Where are they coming from? Are they finding you through Google, social media, email campaigns, advertisements, or other websites?
- What are they doing? Which pages are they viewing, how are they interacting with your content, and are they taking meaningful actions?
Think of your website as a physical store.
Imagine opening a store, spending money on advertising, and inviting people inside.
You would probably want to know how many people walked through the door, which displays attracted their attention, and whether anyone purchased something.
Running a website without traffic tracking is similar to operating that store without knowing how many customers entered or what interested them.
You might be working hard to attract attention, but you wouldn’t have enough information to understand what’s helping your business grow.
Website traffic tracking gives you a clearer picture.
And the good news?
You don’t need to track every possible number to start making better marketing decisions.
You just need to understand a few important measurements.
Understanding Visitors, Sessions, and Pageviews
When you first open a website analytics dashboard, you’ll probably encounter several unfamiliar terms.
Three of the most important are users, sessions, and pageviews.
Although these measurements are related, they don’t mean the same thing.
1. Users: How Many People Visit Your Website?
In Google Analytics 4, a user represents someone who interacts with your website or app, as identified by the analytics system.
For beginners, it’s helpful to think of users as an estimate of how many distinct visitors your website receives.
However, this isn’t necessarily a perfect count of individual human beings.
Someone visiting from a phone and later from a laptop may be counted separately, depending on how analytics identifies them.
Google Analytics also distinguishes between different user metrics, including total users and active users.
The important takeaway: User metrics help you understand the size of your audience, but they shouldn’t be treated as an exact headcount.
2. Sessions: How Often Do People Visit?
A session represents a period of activity on your website.
One person can generate multiple sessions.
For example, imagine someone discovers your website through a Google search on Monday morning.
They read an article, explore another page, and leave.
Later that evening, they return to read another article.
That’s one person who may generate two separate sessions.
Sessions help you understand how frequently people are visiting and interacting with your website.
They are particularly useful when examining traffic sources and comparing marketing campaigns.
The important takeaway: Sessions measure visits, not necessarily unique people.
3. Pageviews: How Many Pages Are Viewed?
A pageview is recorded when someone views a page on your website.
If someone reads your homepage, opens a blog article, and then visits your contact page, that activity can generate three pageviews.
If they reload a page, that can generate another pageview.
This means pageviews are not the same as visitors or sessions.
A single visitor can generate multiple pageviews during one session.
Pageview information can help you identify which articles, guides, and website pages attract attention.
However, a high pageview count doesn’t automatically mean people are interested in purchasing your products or signing up for your email list.
The important takeaway: Pageviews tell you how often pages are viewed, not whether those views produced meaningful results.
A Simple Example of Website Traffic Metrics
Let’s imagine your website receives the following activity during one week.
| Website Metric | Example Result |
|---|---|
| Total users | 150 |
| Sessions | 210 |
| Pageviews | 420 |
| Email signups | 12 |
These are hypothetical numbers, but they illustrate an important point.
Your website might attract 150 users who collectively generate 210 sessions and 420 pageviews.
During that same period, 12 email signups might be recorded.
Now you have something more useful than a visitor count alone.
You can begin asking questions such as:
- Which traffic sources brought visitors who signed up?
- Which pages encouraged people to explore more content?
- Did certain articles attract visitors but produce very few leads?
- Were your marketing campaigns attracting the right audience?
This is where website traffic tracking starts becoming a practical business tool rather than a collection of numbers.
One important distinction: If you calculate a conversion rate, you must choose the correct denominator. For example, 12 signups divided by 210 sessions is approximately a 5.7% session-based signup rate, assuming each signup is counted once. A user-based rate would be calculated differently.
Why Website Traffic Tracking Matters for Small Businesses
When you’re starting an online business, your time and resources are often limited.
If you’re still building your audience, our guide to getting your first 100 website visitors explores practical ways to begin attracting traffic before you have much data to analyze.
You might be writing blog articles, sharing content on social media, building landing pages, managing email campaigns, and experimenting with different advertising methods.
Without tracking, it’s difficult to know which activities deserve more attention.
For example, imagine you’re promoting the same landing page through Facebook, an email campaign, and a traffic exchange.
You notice that your website received a significant increase in visits.
That’s encouraging.
But where did those visits come from?
And did any of those visitors subscribe to your email list?
Without appropriate tracking, you may have no reliable way to connect your promotional activities to their results.
With the right information, you can begin identifying which traffic sources attract engaged visitors and which ones may need improvement.
You might discover that one source generates plenty of visits but very few signups, while another brings fewer visitors who are more interested in your offer.
That doesn’t automatically mean the first traffic source is worthless.
Different traffic sources serve different purposes, and some visitors need time before taking action.
However, tracking gives you a stronger foundation for deciding where to spend your time, energy, and advertising budget.
The goal isn’t simply to attract the largest possible audience. It’s to understand whether you’re reaching people who are likely to benefit from what your website offers.
And that brings us to the next important part of the equation.
Knowing how many people visit your website is useful.
Knowing what those visitors do next is where conversion tracking comes into play.
What Is Website Conversion Tracking?
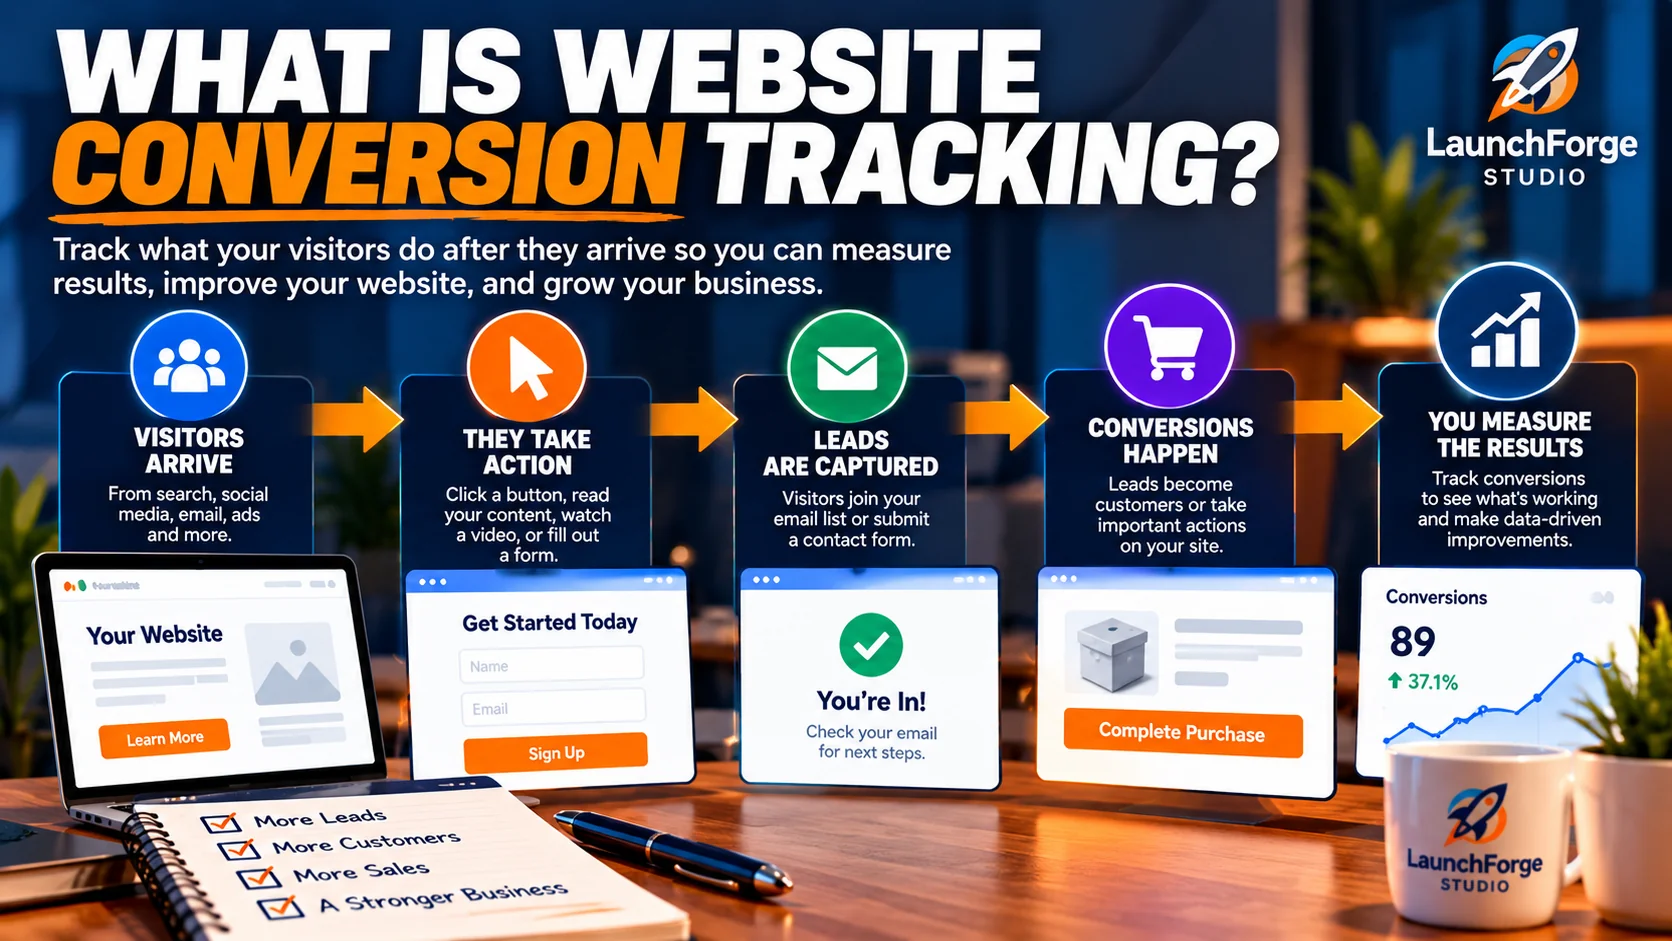
Website conversion tracking helps you measure meaningful visitor actions, from email signups to purchases.
Website conversion tracking is the process of measuring when visitors complete specific actions that matter to your business.
Those actions might include subscribing to an email list, submitting a contact form, downloading a free resource, clicking an affiliate link, or purchasing a product.
In other words, website traffic tracking helps you understand how people arrive at your website, while conversion tracking helps you understand what they accomplish once they’re there.
And there’s an important distinction every beginner should understand.
Not every website visitor is a potential customer, and not every meaningful conversion involves a sale.
Someone might discover your business for the first time, read a helpful article, and subscribe to your email list.
They haven’t purchased anything.
But they’ve taken a meaningful step toward building a relationship with your business.
For a beginner trying to establish an online presence, that action can be valuable.
The purpose of conversion tracking is to identify these important actions and understand how often they happen.
What Counts as a Website Conversion?
A conversion occurs when someone completes an action you’ve identified as valuable.
What qualifies as a conversion depends on your website, your goals, and the type of business you’re building.
For example, a local service business might consider a completed appointment request a conversion.
An online store might focus on purchases.
A blogger might want readers to subscribe to an email newsletter.
An affiliate marketer might track clicks on promotional links as an indication of interest.
Let’s look at several common examples.
1. Email Newsletter Signups
Imagine someone discovers one of your blog articles through Google.
They enjoy the information, notice your email signup form, and decide to subscribe.
That signup represents a conversion if growing your email list is one of your goals.
If you’re just getting started, our guide on how to build an email list from scratch explains how to begin attracting subscribers and growing an audience for your online business.
Email subscribers give you an opportunity to continue providing helpful information after visitors leave your website.
However, a subscriber isn’t automatically a paying customer.
2. Contact Form Submissions
Suppose you offer business services through your website.
A visitor reads about those services and submits a contact form requesting more information.
That completed form submission can be tracked as a conversion.
It’s a useful indication that someone has moved beyond casually browsing your content.
Learning how to turn website visitors into leads can help you build on that initial interest and create more opportunities to connect with potential customers.
But remember, a submitted form doesn’t guarantee that the inquiry will become a paying customer.
3. Free Resource Downloads
Many websites offer free resources such as checklists, templates, guides, or downloadable worksheets.
If you’re interested in creating something valuable to offer your visitors, our step-by-step guide on how to create a lead magnet explains how to develop a free resource that encourages people to join your email list.
When someone downloads one of those resources, it may indicate interest in a particular subject.
If downloads support your business goals, you can track them as conversions.
Depending on how the resource is delivered, tracking may involve a download event, a completed signup form, or a confirmation page.
4. Affiliate Link Clicks
Affiliate marketers often recommend products, platforms, or services through their websites.
When a visitor clicks an affiliate link, that action can be tracked as an outbound click.
This helps you understand which articles and recommendations encourage readers to explore an offer.
However, there’s an important limitation.
An affiliate link click is not the same thing as an affiliate sale.
Someone might click your link, visit the merchant’s website, and decide not to purchase.
To measure actual affiliate commissions or sales, you’ll generally need information from the affiliate program’s reporting system.
Website analytics and affiliate dashboards can complement each other, but they don’t necessarily measure the same activity.
5. Product Purchases
For an online store, a completed purchase is often one of the most important conversions.
Tracking purchases can help a business understand which marketing channels contribute to revenue.
However, accurate purchase tracking generally requires additional ecommerce measurement setup.
Simply installing a website analytics tool doesn’t guarantee that every purchase will automatically be recorded correctly.
Micro-Conversions vs. Macro-Conversions
Not every conversion represents the same level of progress.
Some actions indicate early interest, while others represent the primary outcome you’re trying to achieve.
These are often described as micro-conversions and macro-conversions.
Micro-conversions are smaller actions that suggest a visitor is engaging with your website or moving toward a larger goal.
Examples might include:
- Clicking a product recommendation.
- Downloading a helpful resource.
- Signing up for an informational webinar.
- Clicking through to a service page.
- Starting a registration process.
Macro-conversions represent major business goals.
Depending on your website, these might include:
- Completing a product purchase.
- Submitting a qualified service inquiry.
- Registering for a paid membership.
- Booking a consultation.
- Completing another primary business objective.
These categories aren’t universal.
For a business focused primarily on building an email audience, a newsletter signup might be considered a macro-conversion rather than a micro-conversion.
The important thing is to decide which actions matter most to your particular business.
A useful conversion is one that helps you evaluate progress toward a clearly defined goal.
These smaller actions can also play a role in a larger customer journey. Our guide on how to build a sales funnel explains how to create a simple process that helps visitors move from initial interest toward a meaningful next step.
What Is a Website Conversion Rate?
A website conversion rate measures the percentage of visitors or sessions that result in a desired action.
It’s one way to understand whether your website is encouraging people to take meaningful steps.
For a simple session-based calculation, the formula is:
Conversion Rate = (Sessions With a Conversion ÷ Total Sessions) × 100
Let’s imagine your website receives 500 sessions during one month.
During that period, 25 sessions include at least one completed email signup.
Your session-based conversion rate would be:
(25 ÷ 500) × 100 = 5%
That means 5% of your website sessions included the desired signup action.
Now imagine another month when your website receives 1,000 sessions, but only 20 sessions include an email signup.
Your session-based conversion rate would be:
(20 ÷ 1,000) × 100 = 2%
Even though traffic doubled, the percentage of sessions resulting in a signup decreased.
That doesn’t automatically mean your marketing failed.
Perhaps you started attracting visitors who were researching a different topic, or a new campaign introduced your website to people who weren’t ready to subscribe.
But it does give you something worth investigating.
More website traffic isn’t necessarily better if it doesn’t support your business goals.
One technical detail is worth knowing: Google Analytics 4 distinguishes between session key event rates and user key event rates. These use different denominators, so the rate shown in a report may differ from a manually calculated rate. Counting every event occurrence can also produce a different result from counting sessions in which an event occurred.
How Google Analytics 4 Measures Important Actions
Google Analytics 4, commonly called GA4, uses events to record interactions with your website.
An event might represent someone viewing a page, clicking a link, submitting a form, or completing a purchase.
Some events are collected automatically, while others require additional configuration.
For example, GA4 can collect page-view information when it’s installed correctly.
Enhanced measurement can also collect certain interactions, such as eligible outbound link clicks and file downloads, when the relevant options are enabled.
However, not every business-specific action is automatically tracked.
If you want to measure a successful lead form submission or a completed purchase, you may need to configure and test the appropriate event.
GA4 also allows you to identify particularly important events as key events.
A key event is an event you’ve designated as important to measuring the success of your business.
For example, if building your email list is a major goal, you might designate a properly configured successful signup event as a key event.
That allows you to evaluate how often that important action occurs.
Don’t worry if this sounds technical right now.
Later in this guide, we’ll walk through the beginner-friendly process of choosing a conversion goal, identifying the right event, and checking whether your tracking works.
For now, remember this:
Traffic tells you that people arrived. Conversion tracking helps you understand whether they took an action that matters.
Why Conversion Tracking Matters for Your Marketing Budget
When you’re building an online business, every dollar and every hour of effort counts.
You might be promoting blog articles through social media, sending email campaigns, testing advertising platforms, or sharing affiliate recommendations.
Without conversion tracking, it’s easy to focus on whichever activity produces the biggest traffic number.
But consider this hypothetical example.
You promote the same landing page through two different advertising sources.
Traffic Source A
- 1,000 website sessions.
- 10 sessions with an email signup.
- Session-based signup rate: 1%.
Traffic Source B
- 200 website sessions.
- 12 sessions with an email signup.
- Session-based signup rate: 6%.
Traffic Source A generated five times as many sessions.
Yet Traffic Source B produced more sessions with a signup.
That doesn’t automatically make Source B the better investment.
You would also want to consider advertising costs, lead quality, the reliability of your tracking, and whether those subscribers eventually engage with your business.
However, the example demonstrates why measuring results can be more useful than comparing traffic totals alone.
It also explains why traffic exchange views, advertising impressions, and actual website conversions should never be treated as interchangeable measurements.
Each tells you something different.
And when you understand those differences, you’re better equipped to make informed decisions about your marketing.
The goal of conversion tracking isn’t to turn every visitor into a customer. It’s to understand which activities are helping your business move forward.
Now that we’ve covered website traffic and conversions, it’s time to look at the specific measurements beginners should pay attention to.
Because while analytics platforms can display dozens of reports and hundreds of numbers, you only need a handful of meaningful metrics to start making smarter decisions.
The Most Important Website Metrics for Beginners
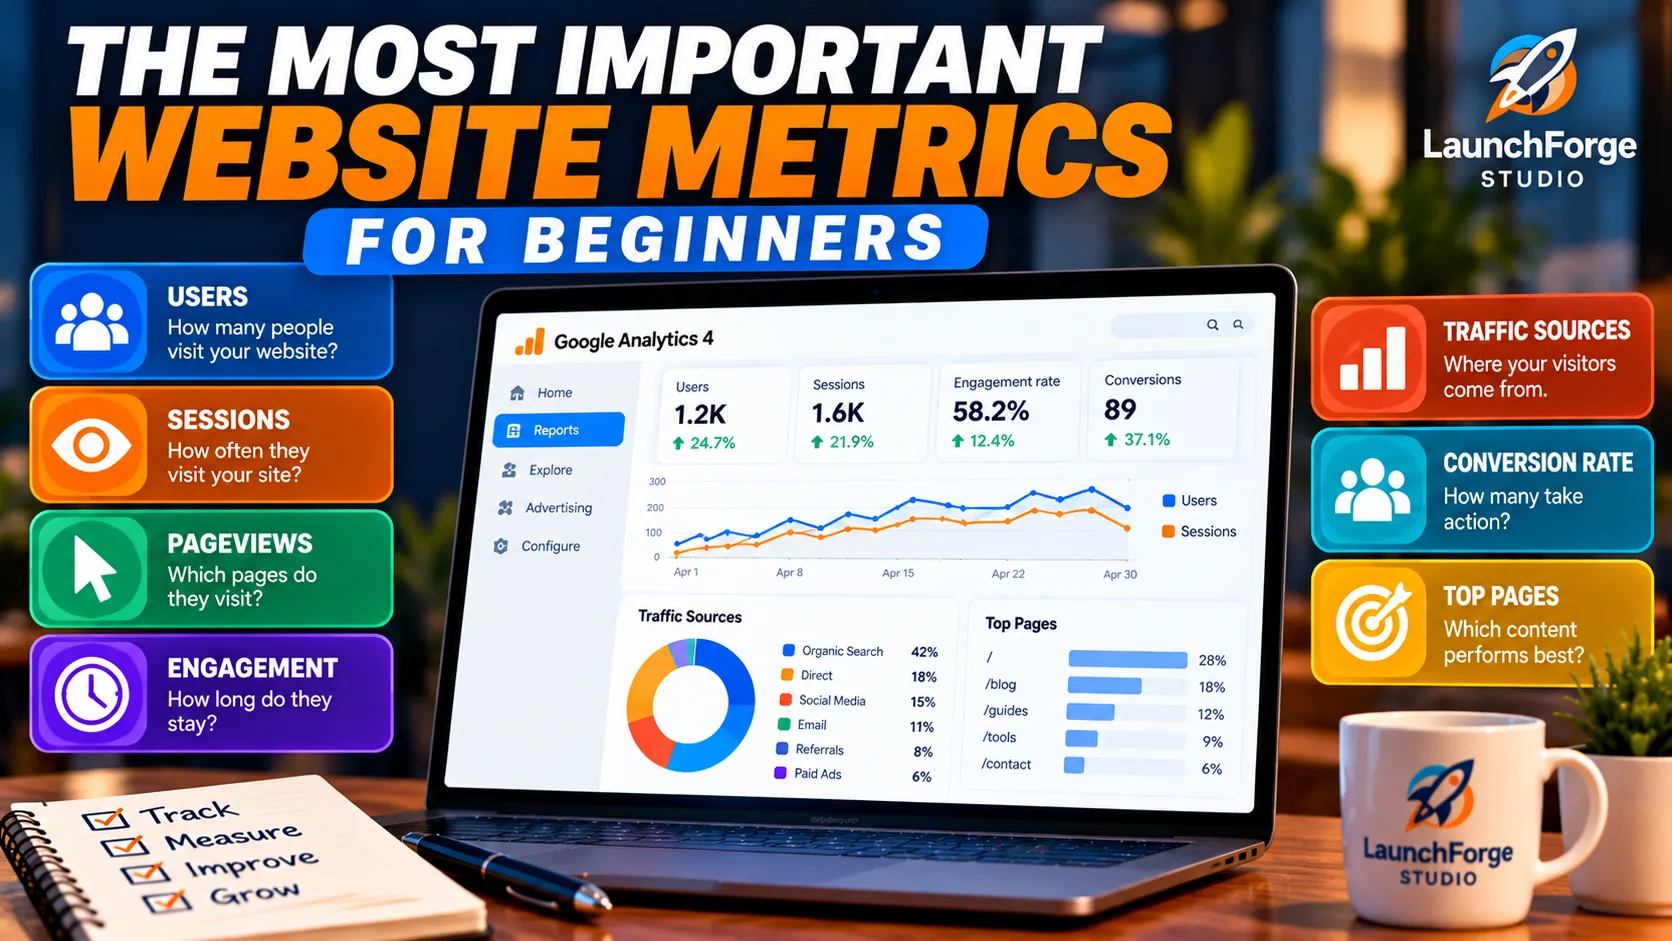
Understanding your website’s key metrics helps you measure performance, identify opportunities, and make smarter marketing decisions.
When you first start learning how to track website traffic, opening an analytics dashboard can feel overwhelming.
There are numbers everywhere.
Users. Sessions. Pageviews. Engagement rates. Traffic sources. Events. Conversions.
And that’s before you start exploring the dozens of reports available in Google Analytics 4.
It’s easy to assume that successful website owners must understand every number on the screen.
Fortunately, that’s not the case.
You don’t need to become an analytics expert to understand whether your website is moving in the right direction.
For most beginners, a handful of meaningful measurements can provide enough information to start making smarter marketing decisions.
The key is knowing what each metric tells you, what it doesn’t tell you, and how it connects to your business goals.
Let’s look at the website metrics worth paying attention to first.
1. Website Users and Sessions
Two of the most useful starting points are users and sessions.
As we discussed earlier, users represent people identified by your analytics system, while sessions represent periods of activity on your website.
These measurements help answer a basic question:
Is anyone actually visiting your website?
If you’re publishing articles, sharing content on social media, or promoting landing pages, you’ll naturally want to know whether those activities are bringing people to your site.
For example, imagine your website recorded 80 sessions last week and 120 sessions this week.
That’s a 50% increase in sessions.
Something may be bringing more traffic to your website.
Perhaps a new blog article started appearing in Google Search. Maybe a social media post attracted attention. Or perhaps an advertising campaign generated additional visits.
But there’s an important limitation.
An increase in sessions doesn’t automatically tell you which activity caused the increase or whether those visitors were interested in your offer.
To understand that, you need to look beyond the overall traffic total.
Beginner takeaway: Use users and sessions to monitor audience activity and identify changes worth investigating.
2. Traffic Sources: Where Your Visitors Come From
Knowing how many people visit your website is useful.
Knowing where those visits originate can be even more valuable.
Traffic sources help you understand how people discover and reach your website.
Google Analytics 4 groups traffic into categories called channels.
Common channels include:
- Organic Search: Visits associated with unpaid search engine results.
- Direct: Visits that analytics cannot attribute to another recognized source, often including people entering your URL or using bookmarks.
- Organic Social: Visits associated with unpaid social media activity.
- Referral: Visits from links on other websites.
- Email: Visits identified as coming from email campaigns.
- Paid Search: Visits associated with paid search advertising.
You may also encounter other channels depending on your marketing activities and how your campaigns are tagged.
For example, imagine you publish a beginner’s guide about building an online business.
Over the following week, visitors arrive through Google Search, Facebook, and a link shared on another website.
Instead of seeing only the total number of sessions, traffic acquisition reporting can help you compare those different sources.
You might discover that Google Search is gradually becoming an important source of visitors.
Or perhaps a particular social media campaign is bringing more people to your website than expected.
This information can help you identify which promotional activities deserve closer attention.
However, attribution isn’t perfect.
Some visits may be categorized as Direct or Unassigned because the necessary source information is missing or cannot be interpreted correctly.
Beginner takeaway: Traffic sources help you understand where visitors originate, but channel labels aren’t always a complete or perfectly accurate picture of how someone discovered your business.
3. Engagement Rate: Are Visitors Interacting With Your Website?
Getting someone to visit your website is one thing.
Encouraging them to engage with your content is another.
Google Analytics 4 includes an engagement rate metric that measures the percentage of sessions classified as engaged.
An engaged session is one that meets at least one of the following conditions:
- Lasts longer than 10 seconds by default.
- Includes a key event.
- Includes at least two pageviews or screenviews.
The engagement-time threshold can be adjusted in GA4 settings.
For example, imagine your website receives 200 sessions during a particular period.
If 120 of those sessions qualify as engaged, your engagement rate would be:
(120 ÷ 200) × 100 = 60%
That means 60% of those sessions met at least one of GA4’s engagement conditions.
Engagement rate can help you identify pages or traffic sources that deserve further investigation.
But it doesn’t tell the entire story.
Someone might visit your website, quickly find the information they need, and leave without spending much time browsing.
That doesn’t necessarily mean the visit was unsuccessful.
Likewise, someone could spend several minutes reading an article without taking any action that supports your business goals.
Beginner takeaway: Engagement rate provides useful context about website activity, but it shouldn’t be treated as a direct measurement of visitor satisfaction or sales potential.
4. Average Engagement Time: How Long Are Visitors Actively Engaged?
Another useful measurement in Google Analytics 4 is average engagement time.
This metric helps you understand how long your website was actively in use, on average, according to the report you’re viewing.
For websites, engagement time generally reflects periods when a page is in focus in the visitor’s browser.
This is different from simply measuring how long a browser tab remains open.
For example, someone might open your article, read it for two minutes, and then switch to another browser tab.
GA4’s engagement measurements are designed to reflect active engagement rather than treating the entire time the tab remains open as reading time.
This metric can be useful when evaluating educational content.
Imagine you publish two articles:
Article A: A short tutorial that answers a specific question.
Article B: A comprehensive beginner’s guide covering several related topics.
Visitors may spend more time engaging with Article B because it contains more information.
But that doesn’t automatically make Article B more useful.
A short tutorial that answers a question quickly can provide an excellent visitor experience.
The goal isn’t to keep everyone on your website for as long as possible.
It’s to help visitors accomplish what they came to do.
Beginner takeaway: Use average engagement time to understand patterns in content interaction, not as a universal score for article quality.
5. Top Pages: Which Content Attracts Attention?
Your website probably contains several different types of content.
You might have a homepage, service pages, blog articles, landing pages, product reviews, and contact pages.
Tracking which pages receive views can help you understand what visitors are exploring.
In Google Analytics 4, the Pages and screens report provides information about page activity.
For example, imagine your website has three articles:
- A beginner’s guide to website traffic.
- A tutorial about creating landing pages.
- A review of an online marketing platform.
You discover that the landing page tutorial receives considerably more views than the other two articles.
That might suggest visitors are particularly interested in learning how to create landing pages.
You could use that information to improve the article, add relevant internal links, or create a supporting tutorial that answers a related question.
However, pageviews alone don’t reveal everything.
A page might receive many views because it ranks well in search results, while another page receives fewer views but generates more qualified inquiries.
Both can be valuable for different reasons.
Beginner takeaway: Identify your most visited pages, then examine whether those pages are helping visitors move toward useful next steps.
6. Key Events: Are Visitors Completing Important Actions?
This is where website measurement begins connecting directly to your business goals.
In Google Analytics 4, a key event represents an event you’ve identified as especially important.
Depending on your business, that might include:
- A completed email signup.
- A successful contact form submission.
- A purchase.
- A completed registration.
- Another meaningful action you’ve configured and verified.
For example, imagine your primary goal is growing an email list.
Your website receives 500 sessions during one week, and 15 sessions include a completed signup.
That tells you more about progress toward your goal than the session total alone.
You can begin exploring whether certain pages or traffic sources are associated with more signups.
But keep one important distinction in mind.
A key event is only as useful as the tracking behind it.
If an event fires when someone merely opens a form rather than successfully submitting it, the numbers could be misleading.
Likewise, if the same action is accidentally recorded multiple times, your reports may overstate what happened.
That’s why setting up and testing your important events matters.
We’ll cover that process later in this guide.
Beginner takeaway: Track a small number of meaningful actions and verify that each one represents what you intend to measure.
7. Conversion Rates: How Often Do Visitors Take Action?
A conversion rate helps you compare meaningful actions with the amount of traffic your website receives.
This can be especially useful when evaluating landing pages, email campaigns, and advertising sources.
For example, imagine two landing pages promoting the same free resource.
| Metric | Landing Page A | Landing Page B |
|---|---|---|
| Sessions | 400 | 200 |
| Sessions with a signup | 12 | 14 |
| Session-based signup rate | 3% | 7% |
These hypothetical results show that Landing Page A received more traffic.
However, Landing Page B had a higher percentage of sessions resulting in a signup.
That might encourage you to examine the differences between the two pages.
Perhaps one has a clearer headline, a more relevant offer, or a simpler signup form.
But don’t assume the page design caused the difference.
The pages might have received visitors from different sources, and those visitors could have had different levels of interest.
To make a fair comparison, you need to consider the audience, traffic source, tracking accuracy, and sample size.
Beginner takeaway: Conversion rates can reveal opportunities for improvement, but they need context before you make major decisions.
8. Search Clicks and Impressions: How Is Your Website Performing on Google?
If you’re creating articles and tutorials to attract visitors through search engines, Google Search Console provides another valuable set of measurements.
Two of the most important are clicks and impressions.
Search clicks represent clicks from supported Google Search results that lead to your website.
Search impressions generally indicate how often a link to your website appeared in Google Search results under Google’s reporting rules.
These numbers can help you understand whether your content is gaining visibility.
For example, imagine an article receives 2,000 search impressions and 60 clicks.
Its search click-through rate would be:
(60 ÷ 2,000) × 100 = 3%
That means approximately 3% of the recorded impressions resulted in clicks.
However, impressions aren’t website visits.
Someone can see your article in search results without clicking it.
And a click recorded by Search Console won’t necessarily correspond to a session recorded in Google Analytics.
The tools use different measurement systems, so their numbers may not match exactly.
Search Console also provides average position information, which can help you understand search visibility over time.
But average position shouldn’t be interpreted as a guaranteed ranking for every searcher.
Beginner takeaway: Use Search Console to understand how people discover your content through Google Search, and use Google Analytics to examine activity after visitors reach your website.
Which Website Metrics Should Beginners Track First?
With all these measurements available, you might be wondering where to begin.
Here’s the good news.
You don’t need to monitor every available website metric to understand whether your online business is making progress.
For most beginners, eight basic measurements provide an excellent starting point.
1. Users
Users help you estimate the size of your website’s audience.
This gives you a general idea of how many distinct visitors your analytics system identifies during a particular period.
2. Sessions
Sessions help you understand how frequently people visit your website.
Comparing sessions over time can reveal increases or decreases in website activity.
3. Traffic Sources
Traffic sources show where your website visits originate.
This helps you understand whether visitors are arriving through search engines, social media, email campaigns, advertisements, or other websites.
4. Engagement Rate
Engagement rate measures the percentage of sessions that meet Google Analytics 4’s engagement conditions.
It’s a useful starting point for understanding whether visitors are interacting with your website.
5. Top Pages
Your most-viewed pages can reveal which articles, tutorials, and other website content attract attention.
This information can help you identify opportunities to improve existing content or create related resources.
6. Key Events
Key events help you measure important actions such as successful email signups, completed contact forms, or purchases.
These actions must be configured and measured correctly to provide reliable information.
7. Conversion Rates
Conversion rates help you understand how often visitors or sessions result in a desired action.
They can be particularly useful when comparing landing pages and evaluating marketing campaigns.
8. Search Clicks
Google Search Console reports clicks from Google Search results to your website.
This helps you understand how much traffic your content attracts through Google’s search results.
Start Small and Focus on Meaningful Results
You don’t need to check every metric every day.
In fact, constantly watching analytics numbers can become a distraction from the activities that actually help your business grow.
For beginners, a simple weekly review is often a more manageable starting point.
Look for meaningful changes.
Ask yourself whether your content is attracting visitors, whether people are engaging with it, and whether your most important actions are being completed.
Then use that information to identify one practical improvement.
The purpose of website analytics isn’t to collect as many numbers as possible. It’s to understand your website well enough to make better decisions.
Why More Traffic Doesn’t Always Mean Better Results
Let’s bring everything together with one final example.
Imagine your website receives 2,000 sessions during one month.
The following month, you increase your advertising activity and receive 4,000 sessions.
At first glance, that looks like tremendous progress.
Your website traffic doubled.
But suppose your email signup results tell a different story.
During the first month, 60 sessions included a signup.
During the second month, only 40 sessions included a signup.
Your traffic increased, but the number of sessions producing a signup decreased.
That doesn’t automatically mean the additional traffic was worthless.
Some visitors may return later, discover another article, or become interested in your business over time.
But the numbers suggest you should investigate whether your advertising is reaching the right audience and whether your landing page matches visitors’ expectations.
This distinction is especially important when evaluating traffic exchanges, email advertising, and other promotional platforms.
An advertising dashboard might report thousands of impressions, views, or clicks.
Those measurements can be useful within the platform.
However, they aren’t automatically equivalent to verified website sessions, engaged visitors, qualified leads, or completed purchases.
Traffic volume tells you how much activity you’re attracting. Meaningful tracking helps you understand what that activity is accomplishing.
And that is the mindset beginners should bring to website analytics.
You don’t need perfect numbers.
You don’t need to understand every report.
And you certainly don’t need to spend your entire day watching dashboards.
You need a few reliable measurements, clear business goals, and a willingness to make improvements based on what you learn.
Now that you understand which metrics matter, let’s explore how to collect and review them using one of the most widely used website analytics tools available: Google Analytics 4 (GA4).
How to Track Website Traffic With Google Analytics 4
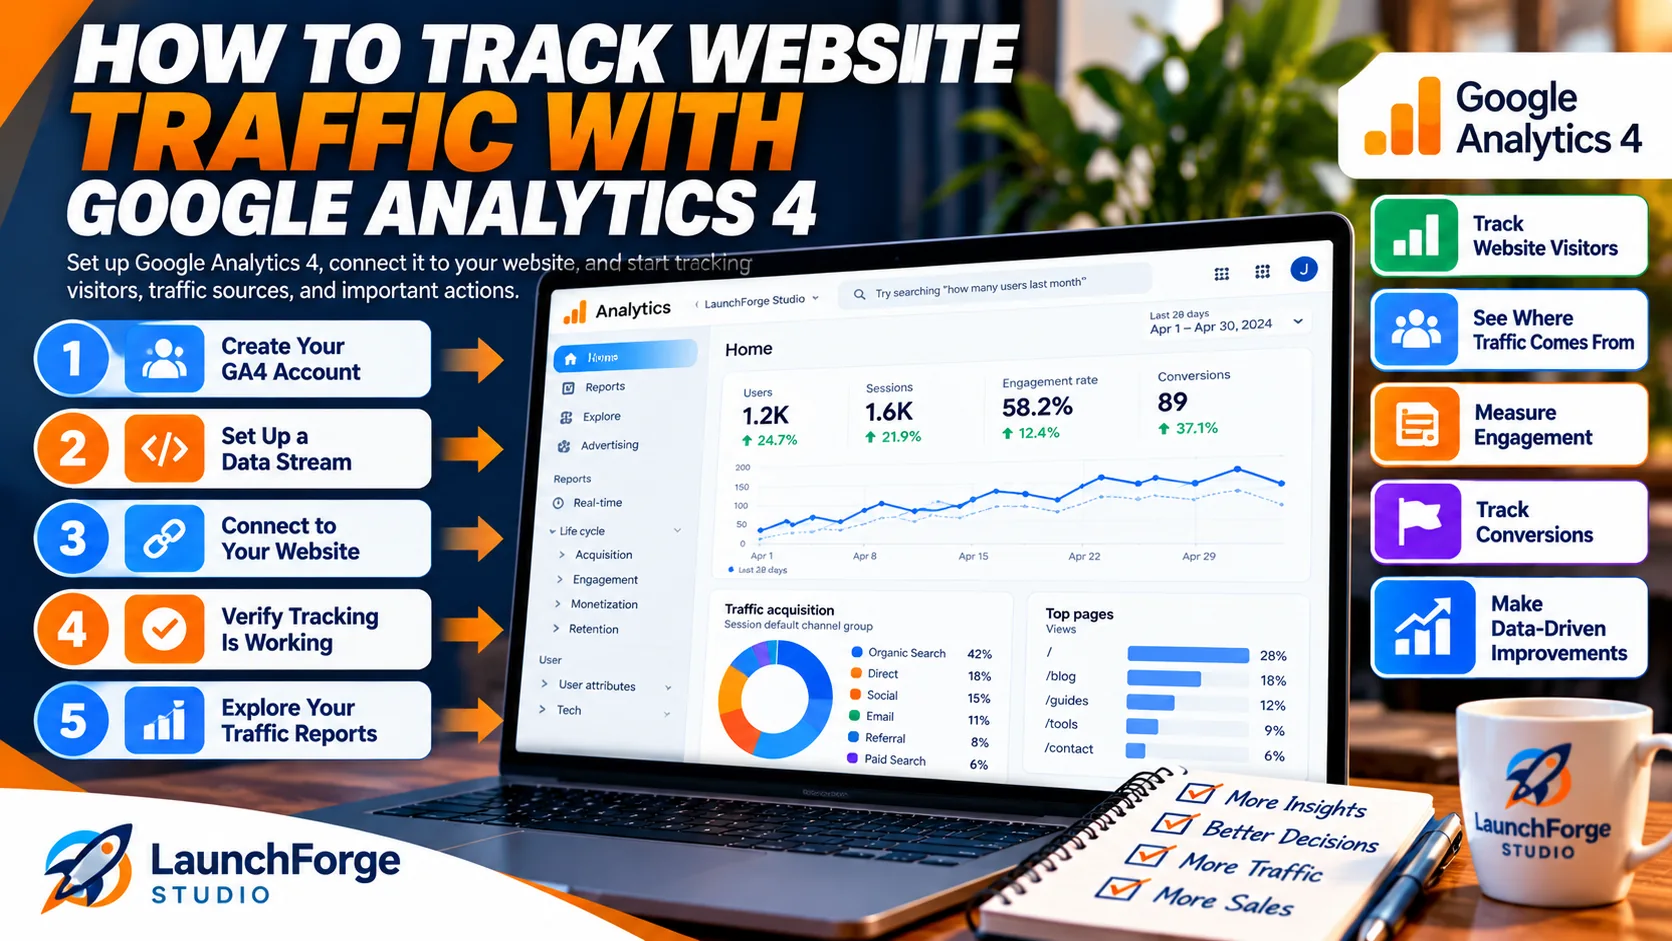
Learn how to set up Google Analytics 4, connect your website, and monitor traffic sources, visitor engagement, and conversions.
Now that you understand which website metrics matter, the next step is learning where to find them.
One of the most widely used tools for this purpose is Google Analytics 4, commonly called GA4.
Google Analytics 4 is a website and app analytics platform that helps you understand how visitors find your website, how they interact with your content, and whether they complete important actions.
And here’s some good news for beginners.
You can start using Google Analytics 4 without purchasing expensive analytics software.
Google provides a free version that offers more than enough functionality for many small websites, blogs, affiliate marketing businesses, and online entrepreneurs.
However, there’s one important thing to understand before getting started.
Google Analytics doesn’t automatically begin tracking your website simply because you have a Google account.
You must create an analytics property, connect it to your website, and verify that information is being collected correctly.
Let’s walk through the process.
Step 1: Create Your Google Analytics 4 Account
If you’ve never used Google Analytics before, your first step is to create an account.
Visit the official Google Analytics website:
Sign in using the Google account you want associated with your website.
Once you’re inside, follow the account setup process.
You’ll generally be asked to provide information such as:
- Account name: A name that helps you identify your business or organization.
- Property name: Usually the name of your website.
- Reporting time zone: The time zone you want your reports to use.
- Currency: The currency appropriate for your business.
- Business details: Information that helps Google tailor the setup experience.
For example, if you’re creating analytics for a small online business, you might use your business name as the property name.
Choose your reporting time zone carefully because it determines how dates are represented in your reports.
After completing the initial setup, Google will guide you toward collecting information from your website.
Beginner tip: Keep your analytics account organized from the beginning. Use recognizable names so you can easily identify your website if you manage additional properties later.
Step 2: Create a Web Data Stream
Google Analytics 4 uses data streams to receive information from websites and apps.
For a standard WordPress website, you’ll typically create a web data stream.
During setup, choose the Web platform when prompted.
You’ll then provide your website’s address and a name for the data stream.
For example:
Website URL: https://yourwebsite.com
Stream name: Your Website Name
After creating the stream, Google provides information you’ll need to connect your website.
One important item is the Measurement ID.
A GA4 web Measurement ID typically begins with:
G-
This identifier tells your website’s tracking setup which Google Analytics data stream should receive its information.
Depending on your installation method, you may need to copy this ID or follow Google’s tagging instructions.
You’ll also encounter a setting called enhanced measurement.
When enabled, enhanced measurement can automatically collect certain interactions beyond basic pageviews.
These may include eligible outbound link clicks, site searches, file downloads, and other supported activities.
However, enhanced measurement doesn’t automatically track every action that matters to your business.
For example, measuring a successfully completed lead form may require additional configuration.
We’ll explore that distinction when we reach the conversion tracking section.
Step 3: Connect Google Analytics 4 to WordPress
Once your web data stream is ready, you need to connect Google Analytics to your WordPress website.
There are several ways to accomplish this.
For beginners, a plugin-based installation is often one of the most manageable options.
One commonly used method is Google’s Site Kit plugin.
Site Kit can help WordPress website owners connect supported Google services, including Analytics and Search Console, from within their WordPress dashboard.
Here’s the general process.
1. Open your WordPress dashboard.
Sign in to the administration area of your website.
2. Navigate to Plugins and choose Add New.
Search for the official Site Kit by Google plugin.
3. Install and activate the plugin.
Follow the setup instructions to connect your Google account and authorize the appropriate services.
4. Connect Google Analytics.
During the Site Kit setup process, or afterward through its settings, connect the appropriate Analytics account and GA4 property.
5. Confirm the correct property is selected.
If you have multiple websites or analytics properties, make sure you’re connecting the one associated with your current website.
Once the connection is established, Site Kit can help place the necessary Google tag on your website.
Important: If your website already has a Google Analytics tag installed through another plugin, Google Tag Manager, or your website’s theme, don’t automatically add a second installation.
Duplicate tagging can produce misleading analytics information.
If you’re unsure whether GA4 is already installed, check your existing plugins and tracking configuration before adding another method.
You don’t need to install several analytics plugins to accomplish the same task.
For beginners, keeping the setup simple and avoiding unnecessary duplication is usually the better approach.
Step 4: Verify That Google Analytics Is Collecting Data
Installing Google Analytics is only part of the process.
You also need to confirm that it’s actually receiving information from your website.
Otherwise, you could spend weeks publishing articles and promoting your business without collecting useful data.
Fortunately, GA4 provides tools to help you verify the connection.
Open Google Analytics and select your website’s property.
Navigate to the reporting area and look for the Realtime report.
This report provides a near-real-time view of recent activity associated with your website.
Now open your website in another browser tab.
Visit your homepage and navigate to one or two additional pages.
Return to Google Analytics and check whether activity appears in the Realtime report.
You may see information about active users, pageviews, and other recently collected events.
Keep in mind that analytics reporting isn’t always instantaneous, and your own visit may not appear if tracking is blocked by browser settings, consent choices, or traffic filters.
If nothing appears, don’t immediately assume the installation failed.
Check the following:
- Is the correct GA4 property selected?
- Is the Google tag installed on the website?
- Does the Measurement ID match the intended data stream?
- Are privacy or consent settings preventing tracking?
- Is an ad blocker interfering with your test?
- Is another analytics installation creating a configuration conflict?
For more detailed troubleshooting, Google’s Tag Assistant and GA4 DebugView can help verify whether events are being sent.
Beginner tip: Always test your analytics installation before relying on the reports to evaluate your marketing performance.
Step 5: Find Your Website Traffic Reports
Once Google Analytics is collecting information, you can begin exploring your website traffic.
One of the most useful reports for beginners is the Traffic acquisition report.
In the standard GA4 reporting structure, you’ll generally find it under:
Reports → Acquisition → Traffic acquisition
Depending on your property’s report customization, the navigation may look slightly different.
The Traffic acquisition report helps you understand where website sessions originate.
For example, you may see traffic associated with:
- Organic Search
- Direct
- Organic Social
- Referral
- Paid Search
Each channel represents a broad category of traffic.
You can use this information to identify which marketing activities are bringing visitors to your website.
Imagine you’ve been publishing helpful blog articles and sharing them through social media.
After several weeks, you notice that Organic Search traffic is gradually increasing.
That could indicate your content is beginning to attract visitors through search engines.
Alternatively, you might notice an increase in Organic Social sessions after sharing an article on Facebook or another social platform.
These reports help you investigate where traffic is coming from rather than relying on guesses.
However, remember that traffic attribution has limitations.
Some visits may appear under Direct or Unassigned because Google Analytics doesn’t have enough reliable information to classify them differently.
The important takeaway: Traffic acquisition reports help you compare website visits by source, but they shouldn’t be interpreted as perfect records of every visitor’s journey.
Step 6: Understand User Acquisition vs. Traffic Acquisition
When exploring Google Analytics 4, you may notice two reports with similar names.
User acquisition and Traffic acquisition.
Although they sound almost identical, they answer different questions.
User Acquisition
This report focuses on how users were first acquired, based on the information available to GA4.
For example, imagine someone discovers your website through Google Search.
They read an article and leave.
A few days later, they return through a link in an email.
The User acquisition report focuses on the source associated with that person’s initial acquisition.
Traffic Acquisition
This report focuses on the sources associated with individual sessions.
Using the same example, the first session might be attributed to Organic Search, while the later session might be attributed to Email if the necessary campaign information is available.
This distinction matters because people don’t always discover a business and take action during the same visit.
Someone might read several articles, return through social media, subscribe to an email list, and eventually purchase something.
Understanding the difference between first-user acquisition and session acquisition helps you interpret your reports more accurately.
Beginner tip: Start with Traffic acquisition when you want to understand where recent visits are coming from. Explore User acquisition when you want to understand how your audience was initially discovered.
Step 7: Discover Which Website Pages Receive the Most Views
Knowing where visitors come from is helpful.
But you probably also want to know which pages they’re exploring.
For that, Google Analytics 4 provides the Pages and screens report.
In the standard reporting structure, you’ll generally find it under:
Reports → Engagement → Pages and screens
This report can help you examine activity associated with individual pages.
Depending on the report configuration, you may see information such as:
- Page titles or page paths.
- Views.
- Active users.
- Average engagement time.
- Event counts.
- Key events.
For example, imagine you’ve published several beginner-friendly tutorials.
One article explains how to create a landing page.
Another covers email marketing.
A third introduces website traffic tracking.
After reviewing your reports, you discover that the landing page tutorial receives substantially more views than the other articles.
That might suggest your audience is particularly interested in landing page creation.
You could use that information to improve the article, add relevant internal links, or create another tutorial addressing a related question.
But remember:
Your most-viewed page isn’t automatically your most valuable page.
An article attracting hundreds of visitors may produce very few leads, while a smaller article may attract readers who are more interested in your products or services.
That’s why page activity and conversion tracking work best when considered together.
Step 8: Compare Website Traffic Over Time
One of the easiest ways to make analytics useful is to compare different time periods.
Instead of checking your website traffic once and making assumptions, look for patterns.
For example, compare:
- This week with the previous week.
- This month with the previous month.
- The last 30 days with the preceding 30 days.
Google Analytics provides date controls that allow you to adjust the reporting period and, in many reports, compare date ranges.
Imagine your website received 300 sessions last month and 450 sessions this month.
That’s a 50% increase in sessions.
At first glance, that looks encouraging.
But before celebrating, ask a few additional questions.
Did the increase come from Organic Search, social media, or advertising?
Did visitors engage with your content?
Did the number of email signups or other meaningful actions increase?
Were there any unusual campaigns or promotions that could explain the change?
Also remember that analytics numbers can fluctuate naturally.
A small website might experience significant percentage changes from relatively minor differences in visitor activity.
For example, increasing from 10 sessions to 20 sessions represents a 100% increase, but it’s still a relatively small amount of data.
Beginner tip: Look for consistent trends over time rather than making major decisions based on a single day’s results.
Common Google Analytics 4 Mistakes Beginners Should Avoid
Before moving on, let’s cover several mistakes that can make your analytics information less useful.
Mistake #1: Installing Multiple Tracking Tags
Adding GA4 through several different methods can create duplicate event collection.
Use a clear installation method and verify that your website isn’t sending unintended duplicate events.
Mistake #2: Assuming Every Visitor Is Tracked
Browser privacy settings, consent requirements, ad blockers, and technical issues can affect data collection.
Google Analytics provides useful measurements, but it doesn’t necessarily capture every website visit.
Mistake #3: Confusing Users With Sessions
One person can generate multiple sessions.
Don’t treat these measurements as interchangeable.
Mistake #4: Ignoring Traffic Sources
An overall traffic increase doesn’t tell you which promotional activity contributed to it.
Review acquisition information to understand the context.
Mistake #5: Assuming Analytics Automatically Tracks Every Conversion
GA4 collects certain events automatically, but important business actions may require additional configuration.
A successful email signup or completed purchase should be measured and tested appropriately.
Mistake #6: Making Decisions Too Quickly
A single day of traffic data rarely tells the complete story.
Look for patterns and consider whether your sample size is large enough to support meaningful conclusions.
Mistake #7: Forgetting Privacy and Consent Requirements
Analytics tools collect information about website activity, so your setup should account for applicable privacy laws, consent requirements, and Google’s policies.
Depending on your visitors’ locations and the technologies you use, additional consent controls may be necessary.
Avoid sending personally identifiable information, such as email addresses, to Google Analytics through event parameters or page URLs.
What Should Beginners Do After Setting Up Google Analytics?
Once GA4 is installed and collecting information, you don’t need to spend hours exploring every available report.
Start with three simple activities.
First, check your Traffic acquisition report.
Identify where your website sessions are coming from.
Second, review your Pages and screens report.
See which articles and website pages receive attention.
Third, begin identifying meaningful actions you want to measure.
These might include email signups, contact form submissions, or other actions connected to your business goals.
That’s enough to establish a useful foundation.
As your website grows, you can explore additional reports and more advanced tracking methods.
But there’s another free Google tool that deserves a place in your beginner analytics toolkit.
While Google Analytics helps you understand what happens on your website, Google Search Console helps you understand how your website performs in Google Search.
And when you use these two tools together, you gain a much clearer picture of how people discover and interact with your content.
How to Track Google Search Traffic With Search Console
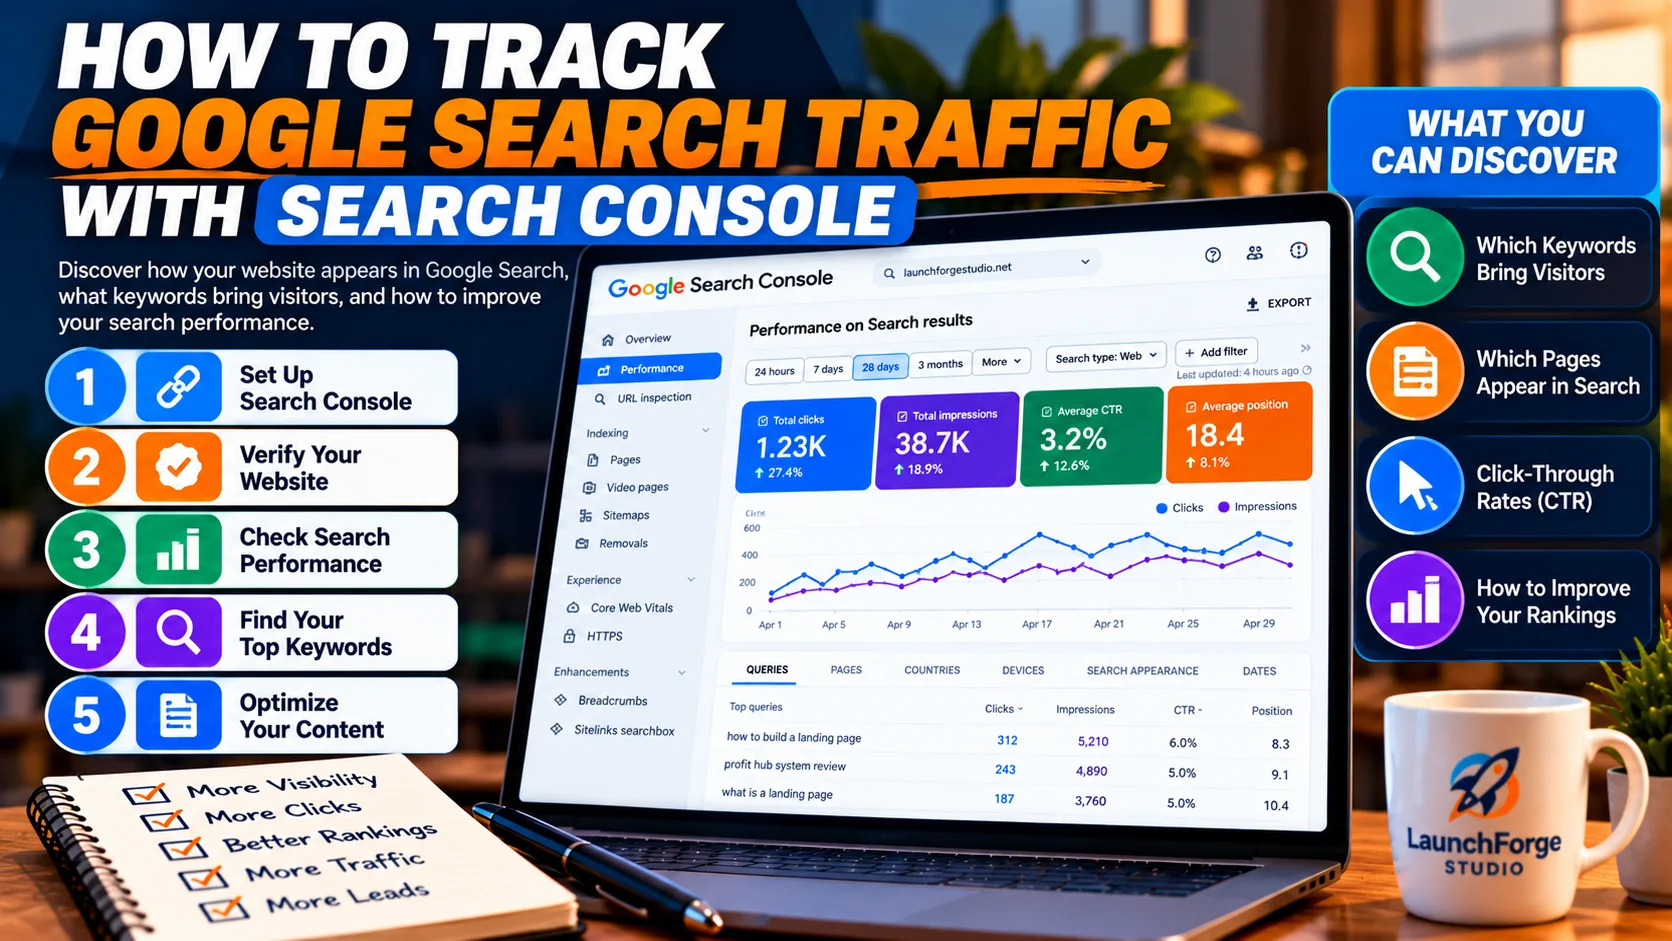
Discover which keywords bring visitors to your website and how Google Search Console helps you improve search visibility.
Now that you understand how Google Analytics 4 helps you measure website activity, let’s explore another free tool that every website owner should become familiar with.
Google Search Console.
While Google Analytics helps you understand how visitors interact with your website, Google Search Console focuses on how your website appears and performs in Google’s search results.
This distinction is important.
Someone might discover one of your articles through Google, see its title in the search results, and decide whether to click.
Google Search Console can help you understand that search visibility.
Once someone reaches your website, Google Analytics can provide information about their activity, subject to your tracking setup and data collection limitations.
Together, these tools help you answer two different questions:
Google Search Console: How are people finding my website through Google Search?
Google Analytics 4: What happens when visitors arrive at my website?
For beginners building an online business, understanding both sides of that journey can help you make more informed content and marketing decisions.
What Is Google Search Console?
Google Search Console is a free service from Google that helps website owners monitor their site’s presence and performance in Google Search.
It provides information about search visibility, indexing, and certain technical issues that may affect how Google discovers and processes your website.
For example, Search Console can help you understand:
- Which search queries generate impressions and clicks.
- Which website pages receive traffic from Google Search.
- How often your pages appear in search results.
- The average click-through rate for your search appearances.
- Your website’s average position in search results.
- Whether Google has indexed particular pages.
- Whether Google reports certain crawling or indexing problems.
You don’t need to purchase a premium SEO platform to access these basic measurements.
And you don’t need to be an experienced search engine optimization specialist to start using them.
The goal is to understand how your website is performing in Google Search and identify opportunities to make your content more useful and discoverable.
Step 1: Set Up Google Search Console for Your Website
If you haven’t connected your website to Google Search Console, start by visiting:
https://search.google.com/search-console/
Sign in using the Google account you want associated with your website.
Google will ask you to add a website property.
You’ll generally encounter two property types.
Domain Property
A Domain property covers supported variations of your domain, including different protocols and subdomains.
For example, a Domain property for yourwebsite.com can include data associated with both HTTP and HTTPS versions and relevant subdomains.
Domain property verification typically requires adding a DNS record through your domain provider.
URL-Prefix Property
A URL-prefix property covers URLs that begin with the exact prefix you specify.
For example:
This property type can support several verification methods, depending on your setup.
These may include an HTML file, an HTML tag, Google Analytics, Google Tag Manager, or DNS verification.
For many beginners, a URL-prefix property can be a manageable starting point, particularly when a supported verification method is already available.
However, a Domain property may provide broader coverage if you want to monitor multiple variations of your domain.
Choose the property type that best fits your website and follow Google’s verification instructions.
Beginner tip: Make sure you’re adding the correct domain or URL prefix. Small differences, such as using HTTP instead of HTTPS, can affect which URLs are included in a URL-prefix property.
Step 2: Find Your Website’s Search Performance Report
Once your website is verified and Google has collected enough information, you can begin exploring your search performance.
Open Google Search Console and select your website property.
In the left-hand navigation, look for Performance and the report for Search results.
Depending on the interface, you may see Search results directly under Performance.
This report provides information about how your website appears in Google Search.
Near the top, you’ll generally find four important measurements:
- Total clicks.
- Total impressions.
- Average click-through rate.
- Average position.
You can also adjust the reporting period and apply filters to explore particular queries, pages, countries, devices, and other available dimensions.
If your website is brand new, don’t be surprised if the report contains little or no information.
Google needs to discover your content, process it, and collect search performance data before meaningful results become available.
Beginner tip: A lack of search performance data doesn’t automatically mean your website is broken. New websites often need time to establish visibility in Google Search.
Step 3: Understand Google Search Clicks
A search click is recorded when someone clicks an eligible link in Google Search that leads to your website.
For example, imagine you’ve published an article explaining how to build your first landing page.
Someone searches Google for information about creating a landing page.
Your article appears in the results.
They click your listing and visit your website.
That interaction can contribute to the click total shown in Search Console.
Clicks help you understand whether people are choosing your website from Google’s search results.
However, there’s an important distinction.
Search clicks aren’t necessarily identical to website sessions in Google Analytics.
The two platforms use different measurement systems.
A Search Console click might not produce a corresponding GA4 session if analytics tracking is blocked, the page doesn’t load as expected, or other measurement conditions interfere.
Likewise, Google Analytics records website activity from many sources beyond Google Search.
Don’t expect the totals in the two platforms to match perfectly.
Instead, use each tool for the purpose it was designed to serve.
Step 4: Understand Search Impressions
An impression generally occurs when a link to your website appears in Google Search results according to Google’s reporting rules.
For example, imagine one of your articles appears in search results for a particular keyword.
Even if the searcher doesn’t click your listing, that appearance may count as an impression.
This helps you understand how often your website is gaining visibility.
Let’s imagine your article receives 3,000 impressions during one month.
That doesn’t mean 3,000 people visited your website.
It means Google recorded 3,000 qualifying appearances of your website’s content in search results.
Some people may have clicked.
Others may have continued scrolling, selected another result, or ended their search.
Impressions can be particularly interesting when you’re publishing new content.
An article might begin receiving impressions before it attracts many clicks.
That could indicate Google is showing the content for certain searches, even though it isn’t yet generating substantial traffic.
However, impressions alone don’t prove that an article is ranking prominently or satisfying search intent.
Beginner takeaway: Impressions measure search visibility, not website visits or business conversions.
Step 5: Understand Click-Through Rate
Click-through rate, commonly abbreviated as CTR, measures the percentage of recorded search impressions that result in clicks.
The basic formula is:
CTR = (Clicks ÷ Impressions) × 100
For example, imagine your article receives:
- 2,000 search impressions.
- 80 search clicks.
Your click-through rate would be:
(80 ÷ 2,000) × 100 = 4%
That means 4% of the recorded impressions resulted in clicks.
CTR can help you evaluate how frequently searchers choose your content when it appears in Google Search.
But don’t assume that every article should achieve the same click-through rate.
CTR can vary depending on:
- The search query.
- Your position in the results.
- The type of search results displayed.
- The searcher’s intent.
- Your page title and description.
- Whether Google displays a different title or snippet.
For example, someone searching for a specific business name may behave differently from someone researching a broad topic.
A page appearing near the top of search results may also receive a different CTR from a page appearing farther down.
That’s why CTR is most useful when examined alongside impressions, queries, and average position.
Beginner tip: If a page receives substantial impressions but relatively few clicks, review the search queries and how your listing appears. A clearer, more relevant title may help, but changing the title doesn’t guarantee higher rankings or more clicks.
Step 6: Understand Average Search Position
Google Search Console also provides an average position metric.
This represents an average of your website’s highest-positioned result for the relevant recorded search appearances, calculated according to Google’s reporting methodology.
For example, imagine an article appears at different positions for different searches.
It might appear near the top for a very specific phrase but much farther down for a broader keyword.
Search Console combines the recorded position information to produce an average.
This means average position isn’t necessarily the exact ranking someone will see when searching Google.
Search results can vary based on location, device, query, and other factors.
Also, the average position displayed for an entire website combines information across many different search queries and pages.
Beginner takeaway: Use average position to identify general patterns, but don’t treat it as a guaranteed ranking for every search.
Step 7: Discover Which Search Queries Bring Visitors to Your Website
One of the most valuable features of Google Search Console is the ability to explore search queries.
These are the searches associated with your website’s recorded appearances in Google Search.
Open the Search results performance report.
Below the performance chart, look for the Queries tab.
Here, you can examine searches associated with impressions and clicks.
For example, imagine you’ve published an article about building an email list.
You might discover that the article appears for searches related to:
- How to start an email list.
- Email list building for beginners.
- How to get email subscribers.
- Building an email list without a website.
These are hypothetical examples, but they illustrate why query information is useful.
You may discover that your content is appearing for questions you didn’t specifically anticipate.
That can reveal opportunities to improve existing articles or create supporting content.
For example, if readers frequently search for a related question that your article barely addresses, you might expand the relevant section to provide a more complete answer.
However, don’t add unrelated keywords simply because they appear in a report.
The goal is to improve how well your content answers real questions, not to stuff articles with search phrases.
Also remember that Search Console doesn’t necessarily display every individual query. Some query data may be omitted for privacy or reporting reasons.
Step 8: Identify Which Articles Attract Google Search Traffic
The Search results report also includes a Pages tab.
This allows you to examine search performance associated with individual website URLs.
For example, imagine you’ve published several educational articles.
One explains how to build a website.
Another covers lead generation.
A third reviews an online marketing tool.
By reviewing the Pages tab, you can identify which articles receive impressions and clicks from Google Search.
You may discover that one beginner’s guide is attracting considerably more search traffic than your other articles.
That information can help you decide where to focus your next improvements.
Perhaps the article would benefit from clearer explanations, updated examples, or links to related tutorials.
You might also discover an article receiving many impressions but relatively few clicks.
That could be worth investigating.
However, don’t assume every low-click page needs a complete rewrite.
Some pages naturally serve narrower audiences, and others may be appearing for searches that aren’t closely related to their primary topic.
Beginner tip: Focus on improving pages that already demonstrate relevant search visibility rather than rewriting articles simply because their numbers are smaller.
Step 9: Check Whether Google Has Indexed Your Website Pages
Search performance isn’t the only useful feature in Google Search Console.
You can also investigate whether Google has indexed particular pages.
Indexing means Google has processed a page for potential inclusion in its search index.
However, indexing doesn’t guarantee that a page will appear prominently in search results or receive traffic.
To inspect a particular page, use the URL Inspection tool near the top of Search Console.
Enter the complete URL of the page you want to examine.
Google will provide information about the URL’s indexing status and other available details.
For example, after publishing a new article, you might inspect its URL to see whether Google has indexed it.
If the page isn’t indexed, Search Console may provide information about its current status.
You can also request indexing for an eligible URL.
But here’s something important.
Requesting indexing doesn’t guarantee that Google will index the page, and it doesn’t guarantee better rankings.
Google determines which pages to crawl and index using its own systems.
Submitting a sitemap can also help Google discover website URLs.
However, a sitemap is a discovery aid, not a promise that every listed page will be indexed.
For beginners, the best approach is to maintain a technically accessible website, publish useful content, and use Search Console to identify issues that genuinely need attention.
Step 10: Use Search Console to Improve Existing Content
Once you’ve collected some search performance information, you can begin using it to make practical improvements.
You don’t need to overhaul your entire website.
Start with one article.
Open the Search results report and examine the performance of a particular page.
Look at its clicks, impressions, CTR, and relevant search queries.
Then ask yourself a few questions.
Is the article appearing for searches that match its topic?
If so, that’s useful evidence that Google associates the page with relevant subjects.
Are people clicking when the article appears?
If the page receives substantial impressions but relatively few clicks, examine the queries, search positions, and listing presentation.
Does the article answer the questions people are searching for?
If important related questions are missing, consider improving the content.
Are there opportunities to help readers explore related topics?
Relevant internal links can make your website easier to navigate and help visitors discover additional resources.
Is the information still accurate?
Tutorials covering software, marketing platforms, and online tools may need occasional updates as features change.
These improvements should be based on usefulness and relevance rather than an attempt to manipulate search rankings.
Remember, search performance can change for many reasons outside your control.
An improvement to an article doesn’t guarantee that its rankings or traffic will increase.
But thoughtful updates can make your content more helpful to the people who discover it.
Google Search Console vs. Google Analytics 4: Which Should You Use?
At this point, you might be wondering whether you really need both tools.
For many website owners, using both provides a more complete understanding of website performance.
Google Search Console helps you understand search visibility.
It shows how your content performs in Google Search, including clicks, impressions, queries, and average position.
Google Analytics 4 helps you understand website activity.
It provides information about visitors, sessions, traffic sources, engagement, and configured important events.
Think of it this way.
Search Console helps you understand what happens before someone clicks through from Google Search.
Google Analytics helps you examine what happens after visitors reach your website.
Neither tool tells the entire story on its own.
And neither can guarantee that every visitor interaction will be measured perfectly.
But together, they provide a useful foundation for making better content and marketing decisions.
You don’t need expensive software or complicated dashboards to begin understanding your website’s performance.
You need to know what you’re measuring, why it matters, and how to interpret the information correctly.
Now that we’ve covered how to track website traffic and Google Search visibility, it’s time to connect those measurements to something even more important.
The actions visitors take after they arrive.
In the next section, we’ll walk through how to track website conversions step by step, including how to choose a meaningful goal, configure important events, and verify that your tracking is working.
How to Track Website Conversions Step by Step
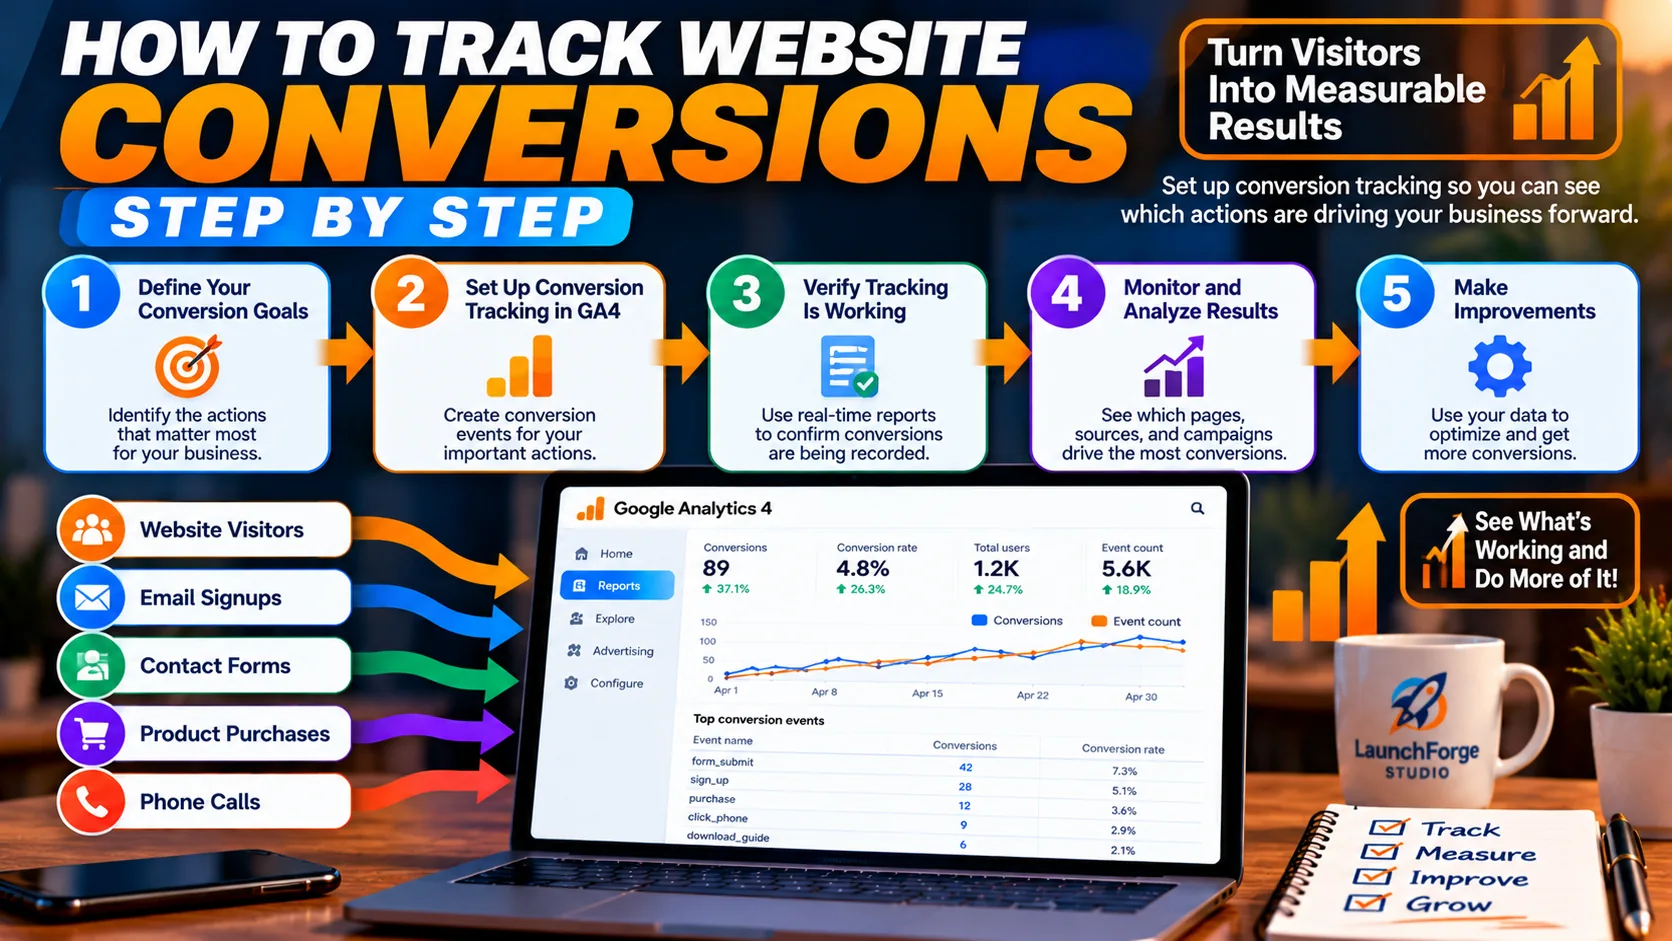
Learn how to measure the actions that matter, from email signups and contact forms to purchases and other conversions.
Learning how to track website traffic is an important first step, but understanding what visitors do after they arrive can be even more valuable.
After all, your website probably exists for a reason.
Maybe you want people to subscribe to your email list, request information about your services, explore an affiliate recommendation, or purchase a product.
Whatever your goal, you need a way to measure whether visitors are taking those actions.
That’s where website conversion tracking comes in.
The good news is that you don’t need to track dozens of different actions when you’re starting out.
The smartest approach is to choose one meaningful goal, configure the appropriate tracking, and verify that everything works before adding more complexity.
Let’s walk through the process.
Step 1: Choose One Meaningful Conversion Goal
Before opening Google Analytics, ask yourself a simple question:
What is the most important action I want visitors to take on my website?
Your answer will depend on the type of online business you’re building.
For example:
- Bloggers: Email newsletter subscriptions.
- Service businesses: Completed contact or inquiry forms.
- Affiliate marketers: Outbound clicks to recommended products or services.
- Online stores: Completed purchases.
- Course creators: Registrations or enrollments.
You might eventually track several of these actions.
Once someone becomes a lead, the next challenge is maintaining that connection. Our guide on how to build a simple follow-up system explains how to nurture interested visitors with helpful, timely communication.
However, choosing one primary goal makes the initial setup easier to understand and manage.
Let’s imagine you’re building an email list.
Your main goal might be:
Track every successfully completed newsletter signup.
Notice the word successfully.
You don’t simply want to count everyone who opens your signup form.
You want to measure when someone actually completes the action.
That distinction becomes important when deciding how to configure tracking.
If generating leads is your primary goal, our guide on how to build a simple lead generation system explains how to connect your website, signup forms, and follow-up process into a manageable system.
Step 2: Identify What Happens After a Successful Conversion
Once you’ve chosen a goal, determine what happens when someone completes it.
For example, when someone submits your email signup form, does your website:
- Display a confirmation message?
- Redirect the visitor to a thank-you page?
- Open a confirmation screen?
- Send the visitor to another website?
- Trigger a specific event through your form software?
These details help determine how you can measure the action.
For beginners, a dedicated thank-you page can sometimes provide a straightforward tracking opportunity.
Imagine your signup form redirects successful submissions to:
https://yourwebsite.com/thank-you/
If that page is used exclusively after a successful signup, you may be able to measure visits to it as an indication of completed registrations.
However, there’s an important limitation.
Someone could revisit or refresh the thank-you page without submitting the form again.
That could create additional recorded activity.
A thank-you page also shouldn’t be treated as proof of a confirmed email subscription if your email service requires visitors to verify their addresses afterward.
The most reliable tracking method is one that records the actual successful action, rather than an unrelated interaction that merely suggests it happened.
Step 3: Understand How Google Analytics 4 Uses Events
Google Analytics 4 measures website interactions through events.
An event represents an activity that occurs on your website or app.
Some events are collected automatically when your tracking setup supports them.
Others require additional configuration.
For example, GA4 commonly uses the following event names:
page_view
Records a pageview when the appropriate conditions are met.
session_start
Indicates the beginning of a session.
first_visit
Identifies a user’s first recorded visit to a website, according to GA4’s measurement.
click
With enhanced measurement enabled, GA4 can collect eligible outbound link clicks using this event.
file_download
With the relevant enhanced measurement option enabled, GA4 can record clicks on links to supported downloadable file types.
These events can provide useful information about website activity.
But here’s something beginners need to understand.
An event isn’t automatically a business conversion.
A pageview might be useful for understanding traffic, but viewing a page isn’t necessarily the primary goal of your business.
Likewise, someone clicking an outbound link doesn’t guarantee that they purchased anything.
You need to identify which events represent meaningful progress toward your goals.
Step 4: Create or Identify the Event You Want to Track
Let’s continue with our email signup example.
You want to know when someone successfully subscribes to your email list.
Depending on how your website and signup form work, you may have several options.
Option 1: Track a Dedicated Thank-You Page
If successful signups redirect visitors to a unique thank-you page, you can use a page-view event and its page-location information to define a separate event for that page.
For example, you might configure an event that fires when the page location matches your signup confirmation URL.
The exact setup depends on your GA4 configuration and the event-creation features available in your property.
Be careful to use the correct page condition so unrelated pages aren’t included.
Also remember that visiting a thank-you page doesn’t necessarily prove a unique or verified signup.
Option 2: Track a Successful Form Submission
Some form builders or marketing platforms can provide information when a form is successfully submitted.
Depending on the platform, this information may be passed to Google Analytics through a supported integration, Google Tag Manager, or a custom implementation.
This can be more precise than tracking a general pageview because the event can be connected to the actual form submission.
However, it requires the form software and tracking setup to support that behavior.
Option 3: Use an Existing Integration
Some website builders, ecommerce platforms, and marketing tools provide integrations that send specific events to Google Analytics.
Before installing additional plugins or writing custom code, check whether your existing tools already support the action you want to measure.
You may be able to accomplish your goal using functionality that’s already available.
Beginner tip: Don’t install multiple tracking systems simply because they promise additional features. Start with the simplest reliable method your existing website tools support.
Step 5: Mark Important Events as Key Events
Once your website is sending the correct event to Google Analytics 4, you can identify it as a key event.
A key event is an event you’ve designated as especially important to your business.
For example, if your website successfully records an event representing a completed newsletter signup, you can mark that event as a key event.
This allows GA4 to include it in reporting related to important business actions.
In the current GA4 interface, event and key-event management is available through the property’s administrative settings, although the exact navigation and available options may vary.
Look for the event management area and the option to mark an appropriate event as a key event.
If you’re creating a new event, follow Google’s current event-creation instructions for your particular setup.
Keep in mind that events generally need to be received and processed before they’re available in certain reporting and management views.
Also, marking an event as a key event doesn’t automatically make the underlying tracking accurate.
If the event is configured incorrectly, your key-event reporting will reflect that incorrect configuration.
The goal is to mark an accurately measured business action as important, not simply to increase the number of conversions displayed in your dashboard.
Step 6: Test Whether Your Conversion Tracking Works
This is one of the most important steps in the entire process.
Never assume your conversion tracking works simply because you’ve finished configuring it.
You need to test it.
Let’s imagine you’ve configured an event to measure successful contact form submissions.
Start by opening your website and locating the form.
Complete a legitimate test submission using appropriate test information.
Then check whether the expected action occurred.
For example:
- Did the form display a success message?
- Did the visitor reach the correct confirmation page?
- Did your form or email system record the submission?
- Was the expected event sent to Google Analytics?
Google Analytics provides several ways to investigate recently collected events.
The Realtime report can help you see recent activity.
For more detailed testing, GA4 DebugView can display events from devices operating in debug mode.
Google Tag Assistant can also help you investigate whether Google tags are installed and functioning.
However, seeing an event in a debugging tool doesn’t guarantee that every future conversion will be recorded perfectly.
Consent settings, browser restrictions, technical problems, and changes to your website can affect data collection.
For that reason, it’s worth repeating your tests after major website or form changes.
Beginner tip: Test both the successful action and situations that shouldn’t count as a conversion. For example, opening a form without submitting it shouldn’t trigger your successful-signup event.
Step 7: Understand Your Conversion Reports
After your events are configured and GA4 begins collecting information, you can explore the results in your reports.
Depending on your property’s reporting configuration, you may be able to examine key events through standard reports, acquisition reports, or customized reporting views.
For example, you might want to answer questions such as:
- How many important actions were recorded this week?
- Which traffic sources were associated with those actions?
- Which landing pages attracted visitors who completed a signup?
- Did a particular marketing campaign contribute to more key events?
- Are important actions increasing as your website grows?
Let’s imagine your website records 20 successful email signup events during one week.
That information can help you evaluate progress toward your email list-building goal.
However, be careful when interpreting event counts.
One person might trigger the same event more than once.
A report showing 20 event occurrences doesn’t necessarily mean 20 unique people subscribed.
If you need an accurate subscriber count, compare your analytics information with the records maintained by your email marketing platform.
Google Analytics helps you understand website activity, while your business systems provide additional information about the actual outcomes.
Using both sources can give you a more complete picture.
Once someone becomes a lead, the next challenge is maintaining that connection. Our guide on how to build a simple follow-up system explains how to nurture interested visitors with helpful, timely communication.
Step 8: Track Affiliate Link Clicks Without Confusing Them With Sales
Affiliate marketers have an additional measurement challenge.
A visitor might read your product review, click an affiliate link, and leave your website to explore the merchant’s offer.
You may be able to track that outbound click.
But what happens afterward usually takes place on another website.
Google Analytics installed on your website generally cannot independently confirm whether that visitor completes a purchase on the merchant’s website.
That’s why it’s important to distinguish between three measurements.
Affiliate Link Clicks
These indicate that someone clicked a tracked affiliate link.
They can help you understand which recommendations attract interest.
Affiliate Program Conversions
These are actions attributed and reported by the affiliate program, such as qualifying sales or registrations.
The program determines which actions qualify and how attribution works.
Affiliate Commissions
These represent earnings reported by the affiliate program, subject to its commission rules, approval process, refunds, and payment conditions.
These numbers may differ for legitimate reasons.
For example, 100 affiliate link clicks don’t automatically produce 100 visitors recorded by the merchant.
And 100 clicks certainly don’t guarantee 100 sales.
If you’re using GA4’s enhanced measurement to track outbound links, make sure the relevant feature is enabled and verify that the clicks you’re interested in are being collected.
Some redirect links, tracking systems, or JavaScript-based interactions may require additional configuration.
Beginner takeaway: Track affiliate clicks to understand visitor interest, but use your affiliate program’s reporting system to evaluate attributed sales and commissions.
Step 9: Calculate a Simple Conversion Rate
Once you’re collecting meaningful information, you can begin calculating conversion rates.
Let’s use a session-based email signup example.
Imagine your website receives 800 sessions during one month.
During that period, 32 sessions include at least one successfully recorded email signup.
Your session-based signup rate would be:
(32 ÷ 800) × 100 = 4%
That means 4% of your website sessions included a signup.
Now imagine the following month your website receives 1,000 sessions, and 50 sessions include a signup.
Your session-based signup rate becomes:
(50 ÷ 1,000) × 100 = 5%
In this hypothetical example, both the number of sessions and the percentage producing a signup increased.
That could be encouraging.
However, before attributing the improvement to a particular change, consider whether the traffic sources, audience, offers, and tracking setup remained comparable.
Also remember that Google Analytics 4 distinguishes between user key event rates and session key event rates.
A user-based rate and a session-based rate can produce different results.
Be consistent about which measurement you’re using when comparing performance.
Beginner tip: Always identify what your conversion rate measures. A signup rate based on sessions isn’t the same thing as a rate based on individual users.
Step 10: Use Conversion Data to Make One Practical Improvement
Once your tracking is working, the goal isn’t to stare at conversion reports all day.
It’s to use the information to make better decisions.
For example, imagine you discover that one of your landing pages receives a steady stream of visitors but generates very few email signups.
Instead of immediately purchasing more traffic, examine the page itself.
Ask yourself:
- Does the headline clearly explain the offer?
- Is the signup form easy to find and complete?
- Does the page explain what visitors will receive?
- Is the call to action specific and understandable?
- Does the page work properly on mobile devices?
- Does the traffic source match the promise made on the landing page?
You might discover that the offer is unclear or the signup form is difficult to use.
Improving those issues could make the existing traffic more useful.
But avoid changing everything at once.
If you rewrite the headline, replace the offer, redesign the page, and change your advertising campaign simultaneously, it becomes difficult to understand which changes contributed to the results.
A more manageable approach is to make one meaningful improvement, monitor the outcome, and continue learning.
The purpose of conversion tracking isn’t to chase perfect numbers. It’s to understand what’s working, identify what needs attention, and make informed improvements over time.
A Simple Conversion Tracking Checklist for Beginners
Before moving on, let’s bring the process together.
When setting up conversion tracking for your website:
- Choose one important business goal.
- Identify the action that represents a successful conversion.
- Determine how your website or marketing tools can report that action.
- Configure the appropriate Google Analytics event.
- Mark the verified event as a key event when appropriate.
- Test that successful actions are recorded correctly.
- Check that unsuccessful or unrelated actions aren’t counted.
- Review your reports alongside information from your business systems.
- Compare results over meaningful periods.
- Use what you learn to make practical improvements.
You don’t have to complete every advanced tracking feature immediately.
Start with one goal.
Make sure it’s measured correctly.
Then build from there.
A small amount of reliable conversion data is often more useful than a complicated dashboard filled with numbers you don’t understand.
Now that you know how to measure important actions on your website, there’s another question worth exploring.
What happens when you’re promoting your business through several different marketing channels?
If you’re sharing articles on social media, sending email campaigns, or purchasing advertising, you’ll want to understand which activities are contributing to your website traffic and conversions.
That’s where campaign tracking becomes especially useful.
How to Measure Traffic From Social Media, Email, and Advertising
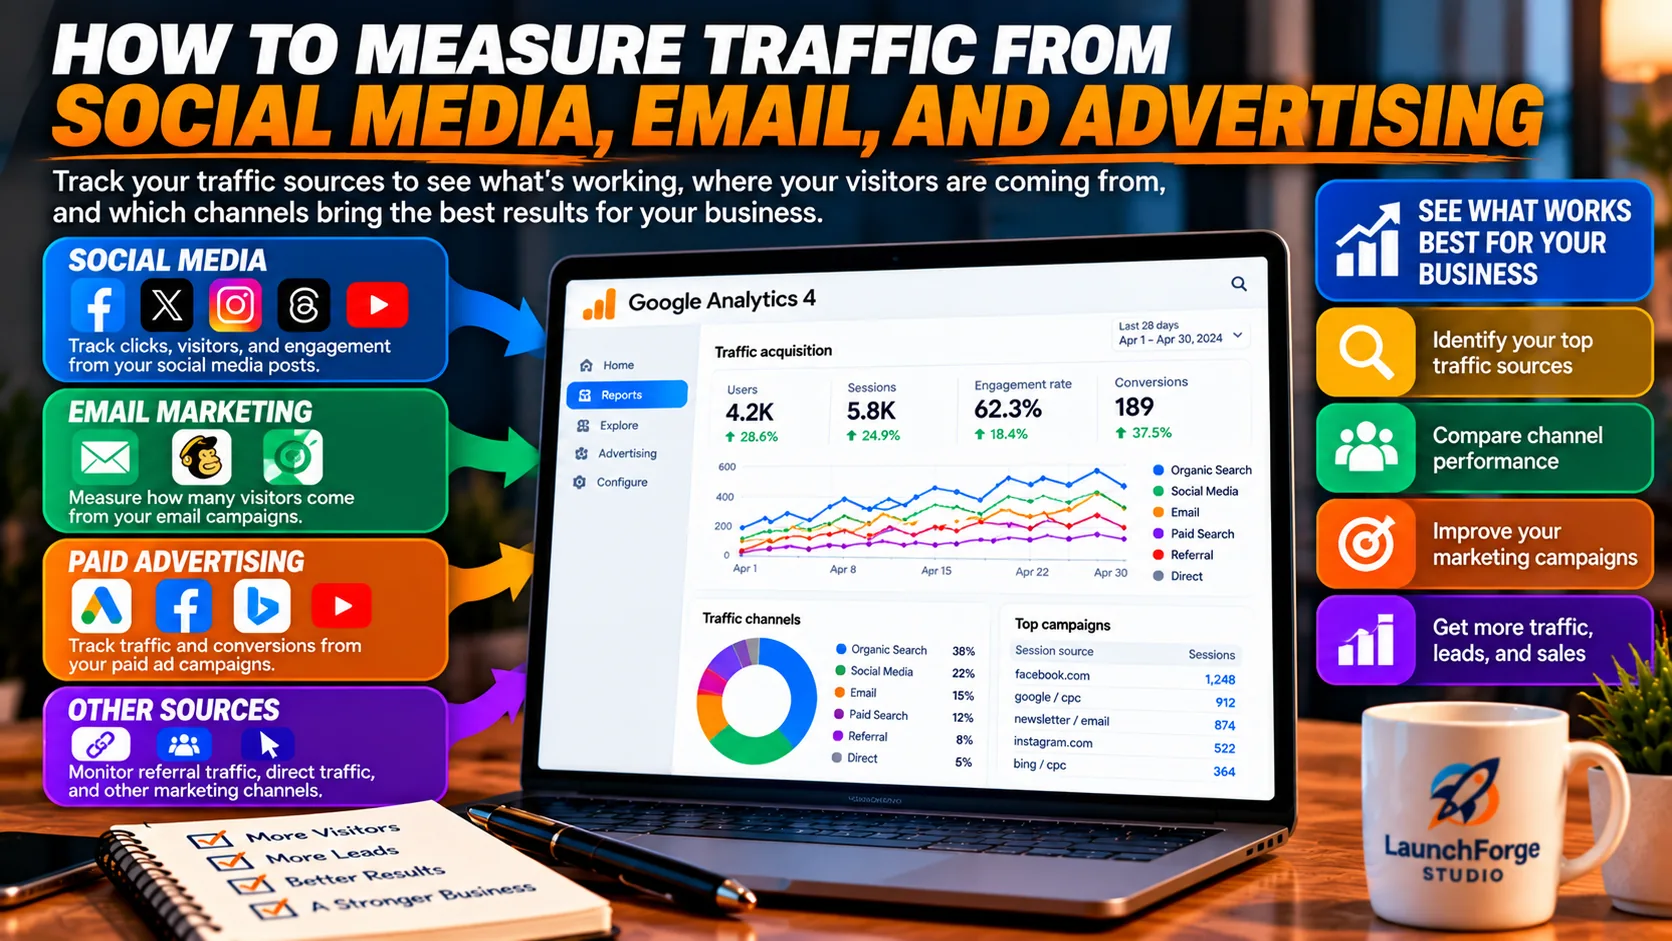
Learn how to identify your most valuable traffic sources, compare marketing channels, and discover which campaigns bring visitors and conversions.
Once you understand how to track website traffic and conversions, the next step is figuring out which marketing activities bring visitors to your website.
This becomes especially important when you’re promoting your business through several different channels.
You might share blog articles on Facebook, publish updates on X or Threads, send email campaigns, or purchase advertising.
Each activity can generate website visits.
But without appropriate tracking, it can be difficult to determine which campaigns are attracting visitors and contributing to your goals.
Fortunately, Google Analytics 4 provides ways to organize and evaluate campaign traffic.
Tracking Traffic From Social Media
When someone clicks a link to your website from a social media platform, Google Analytics may identify that visit as social traffic.
For example, imagine you share a new article on Facebook.
Several people click the link and visit your website.
If the necessary referral information is available, GA4 may classify those sessions under Organic Social.
However, social media attribution isn’t always perfect.
Some apps, browsers, and link-sharing methods may prevent referral information from being passed along.
As a result, some visits may appear under Direct or another channel.
The important takeaway: Social media traffic reports provide useful information, but they won’t always identify every visit’s original source.
Tracking Traffic From Email Marketing
Email campaigns present a similar challenge.
Suppose you send a newsletter featuring your latest tutorial.
Subscribers click the link and visit your website.
Ideally, you’d like to identify those visits as coming from that email campaign.
However, without appropriate campaign information, analytics may not always recognize the source correctly.
This is where campaign tracking parameters become useful.
What Are UTM Parameters?
UTM parameters are pieces of information added to a website URL to help analytics tools identify marketing campaigns.
For example:
https://yourwebsite.com/guide/?utm_source=newsletter&utm_medium=email&utm_campaign=october_guide
In this example:
utm_source=newsletter
Identifies the source of the campaign.
utm_medium=email
Identifies the marketing channel.
utm_campaign=october_guide
Identifies the specific campaign.
When configured correctly, these parameters can help Google Analytics organize campaign traffic.
You don’t need to use UTM parameters on every link.
They’re most useful when you want to distinguish traffic from specific promotional activities.
For example, you might use them for a newsletter, a social media campaign, or an advertising placement.
Important: Avoid adding campaign parameters to ordinary internal links between pages on your website. Doing so can interfere with accurate attribution.
Tracking Paid Advertising and Traffic Exchanges
Advertising platforms often provide their own performance reports.
These might include impressions, clicks, views, or other activity measurements.
However, the numbers shown inside an advertising platform won’t necessarily match the sessions recorded in Google Analytics.
For example, a traffic exchange might report 1,000 views.
That doesn’t automatically mean Google Analytics will record 1,000 sessions.
Some views may not represent completed website visits, while tracking restrictions, page-loading issues, or other technical differences can affect analytics reporting.
Likewise, an advertising click doesn’t guarantee that someone engaged with your content or completed a conversion.
When evaluating advertising performance, consider several measurements together:
- Activity reported by the advertising platform.
- Website sessions recorded in GA4.
- Engagement associated with those sessions.
- Important actions or key events.
- Advertising costs and actual business outcomes.
The goal isn’t to make every reporting system display identical numbers. It’s to understand what each system measures.
How to Compare Marketing Campaigns
Let’s imagine you’re promoting the same landing page through three different channels.
Your Facebook campaign generates website visits.
Your email newsletter attracts returning subscribers.
Your advertising campaign produces additional traffic.
Instead of focusing only on which campaign sends the most visitors, ask:
Which campaign attracts people who engage with the page?
Which campaign is associated with meaningful actions?
How much time or money does each campaign require?
Are the results consistent enough to support a decision?
These questions help you evaluate marketing activities more realistically.
A campaign producing fewer visits may still be useful if those visitors are interested in your offer.
And a campaign generating substantial traffic may serve an awareness-building purpose even if immediate conversions are limited.
The important thing is to measure campaigns against their intended goals rather than assuming every visit has the same value.
Now that you know how to identify traffic from different marketing channels, let’s look at how to use that information to improve your website’s performance.
How to Use Your Traffic Data to Improve Your Website
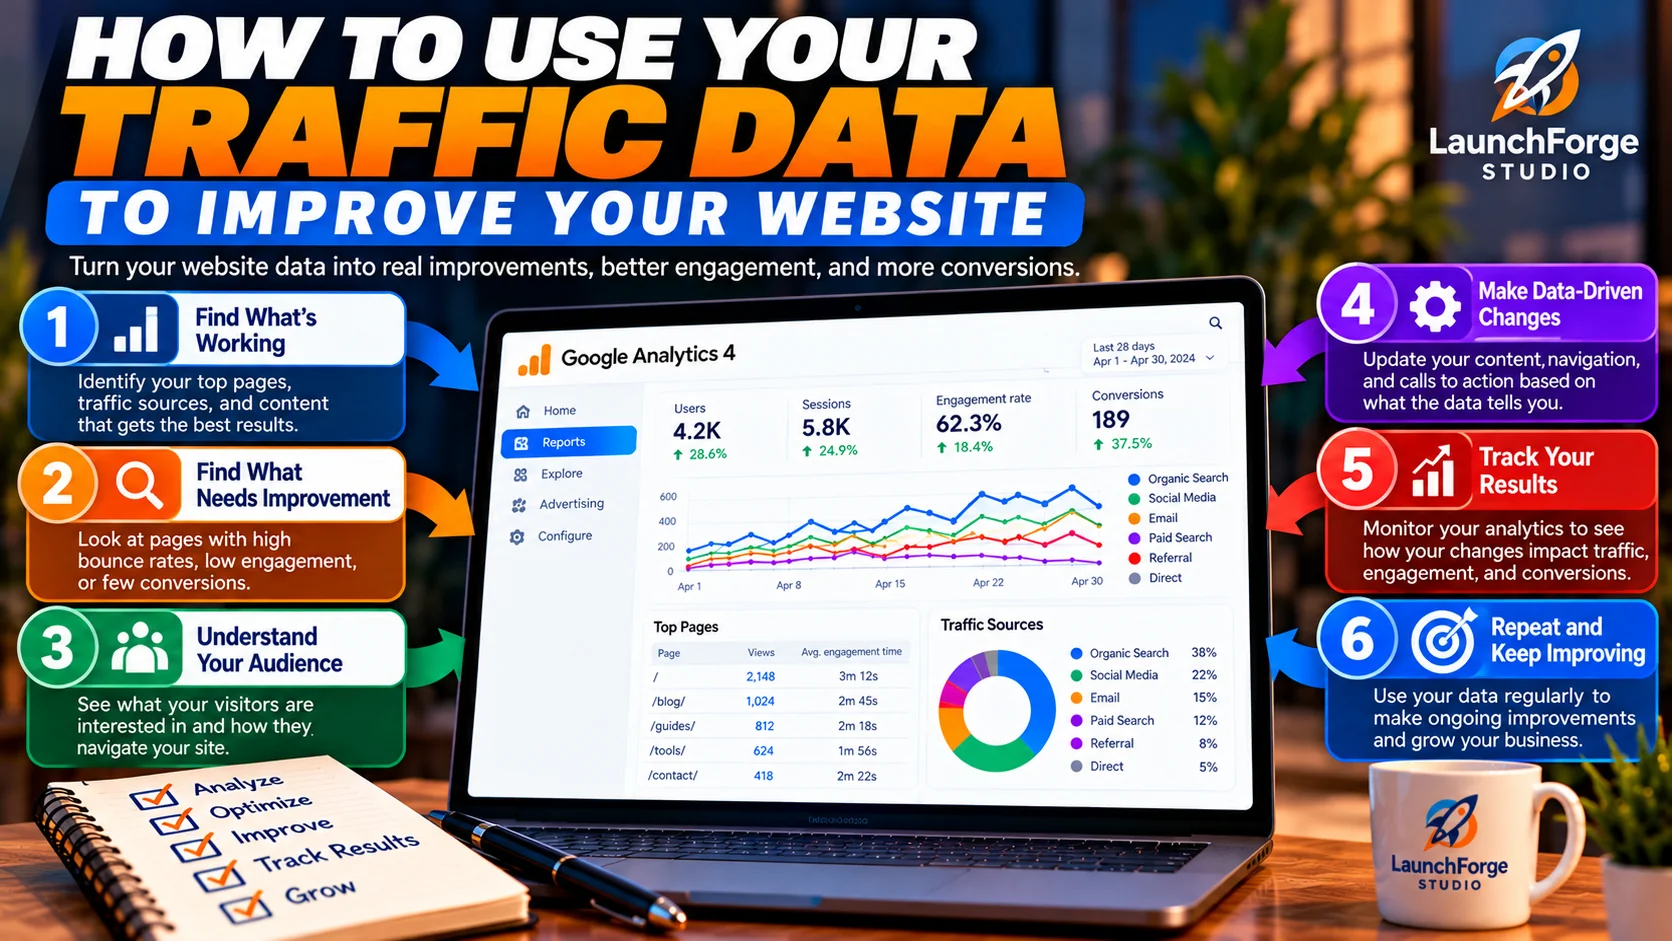
Turn website analytics into practical improvements by identifying what works, fixing weak spots, and measuring your results.
Collecting website traffic data is useful, but the real value comes from what you do with that information.
You don’t need to redesign your entire website or purchase additional marketing tools every time your numbers change.
Instead, look for opportunities to make small, meaningful improvements.
Identify Pages That Attract Visitors but Few Leads
Start by reviewing pages that consistently receive traffic.
Are visitors taking the actions you want them to take?
For example, an article might attract hundreds of visitors but generate very few email signups.
That doesn’t necessarily mean the article is unsuccessful. Its primary purpose might be educating readers rather than encouraging immediate conversions.
However, if generating leads is one of your goals, consider whether the page offers a relevant next step.
A helpful resource, related tutorial, or clearly explained signup opportunity might improve the visitor experience.
Understanding what a landing page is and how it works can also help you create a more focused experience for visitors who arrive through your marketing campaigns.
Improve Your Calls to Action
A call to action, or CTA, tells visitors what they can do next.
Examples include:
- Subscribe to receive helpful tutorials.
- Download a free beginner’s checklist.
- Explore a recommended business tool.
- Read a related guide.
Your CTA should match the content visitors are reading.
Someone learning about website analytics may respond better to a relevant tracking checklist than an unrelated promotional offer.
Make the next step helpful, visible, and easy to understand.
Compare Traffic Sources
Use your analytics reports to examine which channels bring visitors who engage with your website or complete important actions. If you’re still exploring how to get traffic to your online business, start by understanding which marketing channels best fit your audience and goals.
For example, organic search traffic might attract readers researching a particular problem, while email campaigns may bring back people already familiar with your business.
Neither source is automatically better.
Evaluate each channel according to its purpose, costs, and results.
Make One Improvement at a Time
When you identify a potential problem, resist the temptation to change everything immediately.
Choose one improvement.
You might simplify a signup form, clarify a headline, improve mobile readability, or add a relevant internal link. If mobile visitors are struggling with your landing page, learning how to create a mobile-friendly landing page can help you identify practical improvements.
Then monitor the results over a reasonable period.
Remember that changes in traffic and conversions can happen for many reasons. A simple before-and-after comparison doesn’t necessarily prove that your adjustment caused the difference.
When you have enough traffic, controlled testing can provide stronger evidence.
For smaller websites, focus on reasonable improvements and avoid drawing major conclusions from limited data.
The goal isn’t to achieve perfect analytics numbers. It’s to create a website that becomes more useful to visitors while supporting your business goals.
Next, let’s examine some common tracking mistakes that can lead beginners to misunderstand their website’s performance.
Common Website Tracking Mistakes Beginners Should Avoid
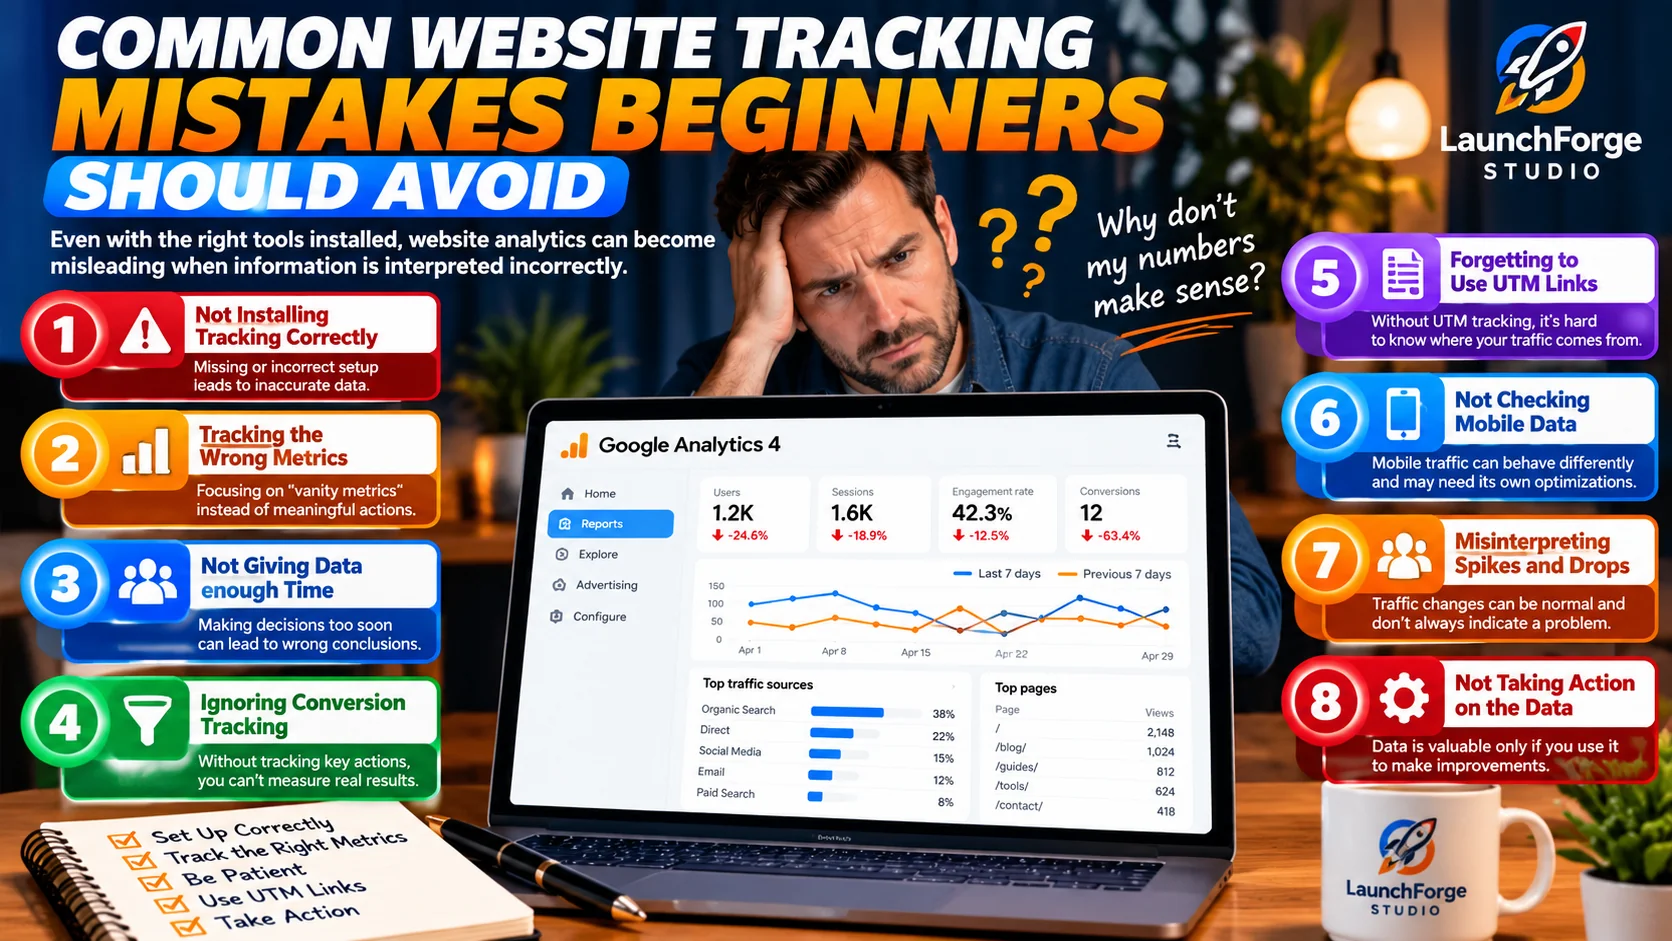
Avoid common analytics mistakes by tracking meaningful metrics, checking your data, and using what you learn to improve your website.
Even with the right tools installed, website analytics can become misleading when information is interpreted incorrectly.
Fortunately, most beginners can avoid the biggest problems by following a few simple principles.
1. Tracking Everything Without a Clear Goal
Google Analytics provides an enormous amount of information, but that doesn’t mean every measurement deserves your attention.
Before reviewing reports, decide what you’re trying to accomplish.
Are you growing an email list, attracting readers, generating inquiries, or promoting affiliate offers?
Start with your business goal, then identify the measurements that help you evaluate progress.
2. Confusing Advertising Impressions With Website Visits
An advertising platform might report thousands of impressions or views.
That doesn’t necessarily mean thousands of people visited your website.
An impression, advertising click, website session, and completed conversion represent different activities.
Understanding those differences is especially important when evaluating paid advertising and traffic exchanges.
Never assume that impressive advertising numbers automatically represent meaningful business results.
3. Making Decisions From Small Amounts of Data
Imagine your website receives five visits one day and ten the next.
That’s a 100% increase.
But with such small numbers, ordinary fluctuations can create dramatic percentage changes.
Avoid making expensive advertising decisions or redesigning entire pages based on a handful of visits.
Look for consistent patterns and consider whether you have enough information to support your conclusions.
4. Expecting Perfect Tracking and Attribution
Website analytics isn’t a flawless record of everything that happens online.
Privacy settings, consent choices, browser restrictions, technical issues, and missing campaign information can affect reporting.
Visitors may also interact with your business across multiple devices and marketing channels before taking action.
Treat analytics as a tool for understanding patterns, not as a perfect reconstruction of every customer’s journey.
5. Forgetting to Review Your Tracking Setup
Website changes can affect analytics.
A redesigned signup form, new landing page, plugin update, or altered redirect may change how important actions are recorded.
Periodically test your most valuable events to confirm that they’re still working as intended.
Reliable tracking requires occasional maintenance, not just a one-time installation.
6. Focusing on Numbers Instead of Visitor Experience
It’s easy to become obsessed with increasing traffic, engagement rates, or conversions.
But behind those measurements are people looking for answers.
A successful website should help visitors find useful information, understand their options, and take appropriate next steps.
Improving clarity, relevance, accessibility, and trust can be more valuable than chasing a particular metric.
The purpose of tracking isn’t simply to make your numbers look better. It’s to help you make your website genuinely better.
Now let’s bring everything
A Simple Weekly Website Tracking Routine
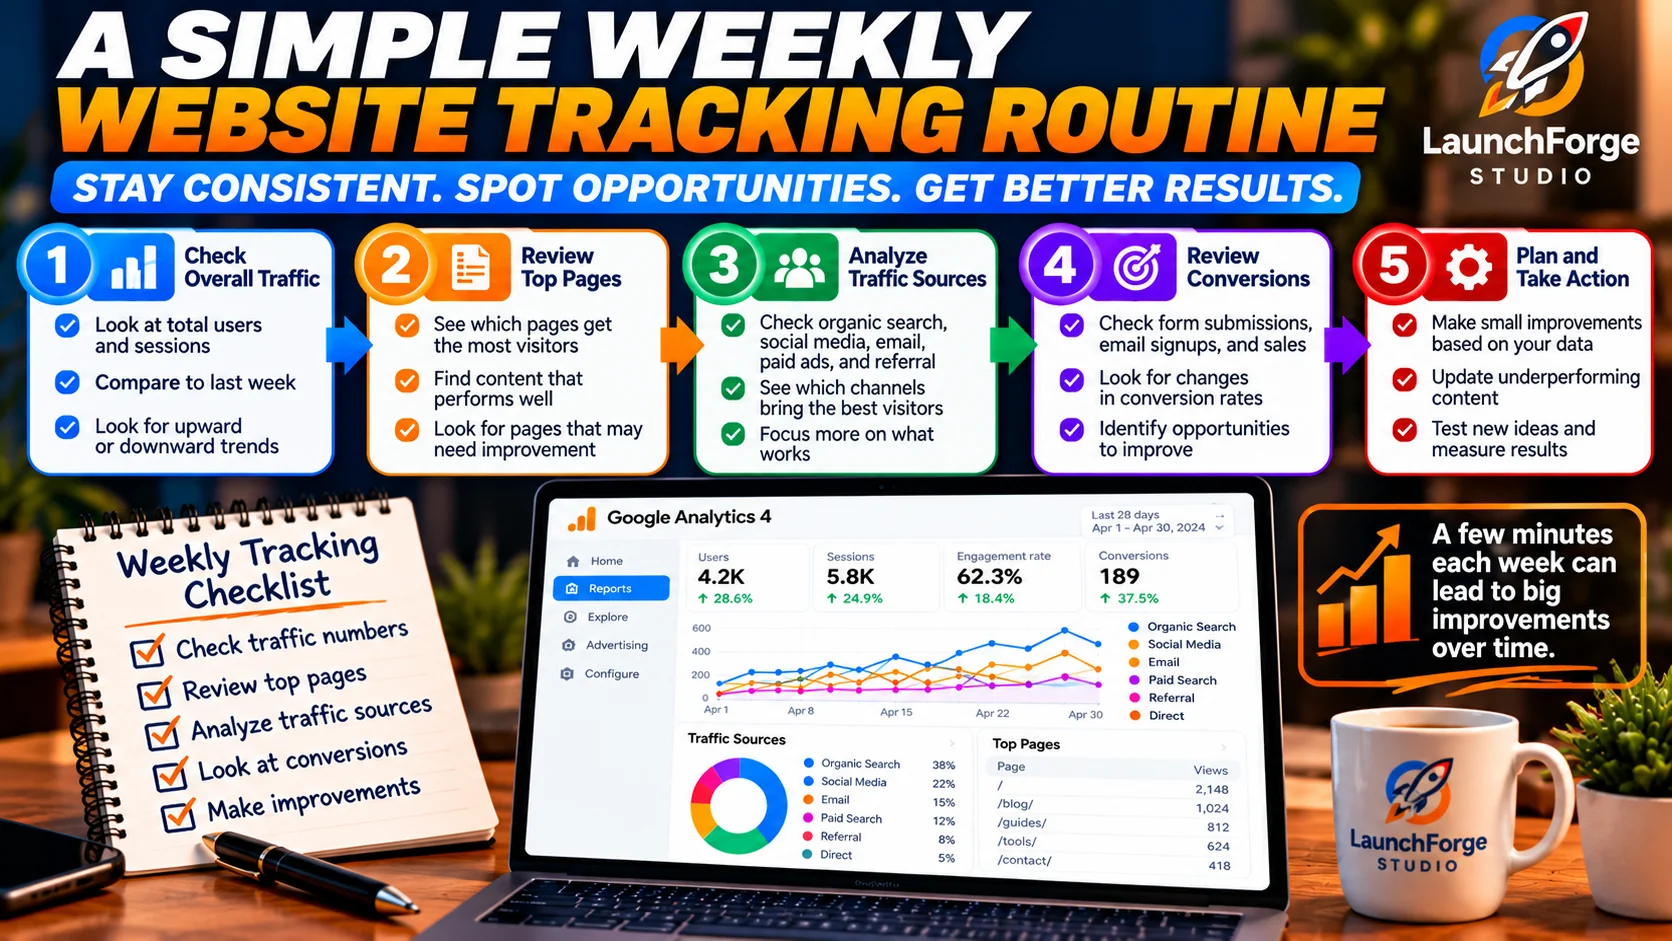
Spend a few minutes each week reviewing your website analytics, identifying opportunities, and making small improvements that support long-term growth.
Learning how to track website traffic doesn’t mean you need to spend hours analyzing reports every day.
For beginners, a simple 15-minute weekly review can be a manageable way to understand website performance and identify opportunities for improvement.
The goal isn’t to examine every available metric.
It’s to develop a consistent habit of checking what matters and using that information to make better decisions.
Here’s a straightforward routine you can follow.
Minutes 1–3: Review Your Website Traffic
Open Google Analytics 4 and select your website property.
Check the number of users and sessions recorded during the previous seven days.
Compare those numbers with the preceding seven-day period.
Look for significant changes, but avoid drawing conclusions from small fluctuations.
Ask yourself:
Is my website attracting visitors, and is that activity changing over time?
Minutes 4–6: Check Your Traffic Sources
Open the Traffic acquisition report.
Identify which channels are bringing sessions to your website.
Are visitors arriving through Google Search, social media, email campaigns, or other websites?
If you’ve recently promoted an article or launched a campaign, look for activity associated with that effort.
Remember that attribution isn’t always perfect, so use these reports to identify patterns rather than expecting an exact record of every visitor’s journey.
Minutes 7–9: Review Your Top Pages
Open the Pages and screens report.
Identify which articles and pages received the most attention.
Look for content that might benefit from a relevant internal link, clearer explanation, or more helpful call to action.
You don’t need to update every page.
Choose one opportunity worth investigating.
Minutes 10–12: Check Important Actions and Search Visibility
Review your configured key events, such as successful email signups or contact form submissions.
Then open Google Search Console and examine recent search clicks, impressions, and relevant queries.
Keep in mind that Search Console performance data may not include the most recent days in full.
For meaningful comparisons, use complete reporting periods whenever possible.
Ask yourself:
Are visitors finding my content, and are any of them taking actions that support my business goals?
Minutes 13–15: Choose One Improvement
Finish your review by identifying one practical action.
For example:
- Improve an unclear call to action.
- Add a relevant internal link.
- Update an outdated explanation.
- Test a signup form.
- Investigate an unexpected traffic change.
Write down what you changed and when you changed it.
Then review the results over time.
Don’t expect every improvement to produce an immediate increase in traffic or conversions.
Consistency matters more than constantly reacting to individual numbers.
As your website grows, you may eventually need more detailed reporting. But for beginners, this simple routine provides a useful starting point without making analytics another overwhelming responsibility.
And that’s the real purpose of website tracking: understanding your progress well enough to make thoughtful improvements while keeping your attention on building a useful online business.
Final Thoughts: Track What Matters, Not Just What Looks Impressive
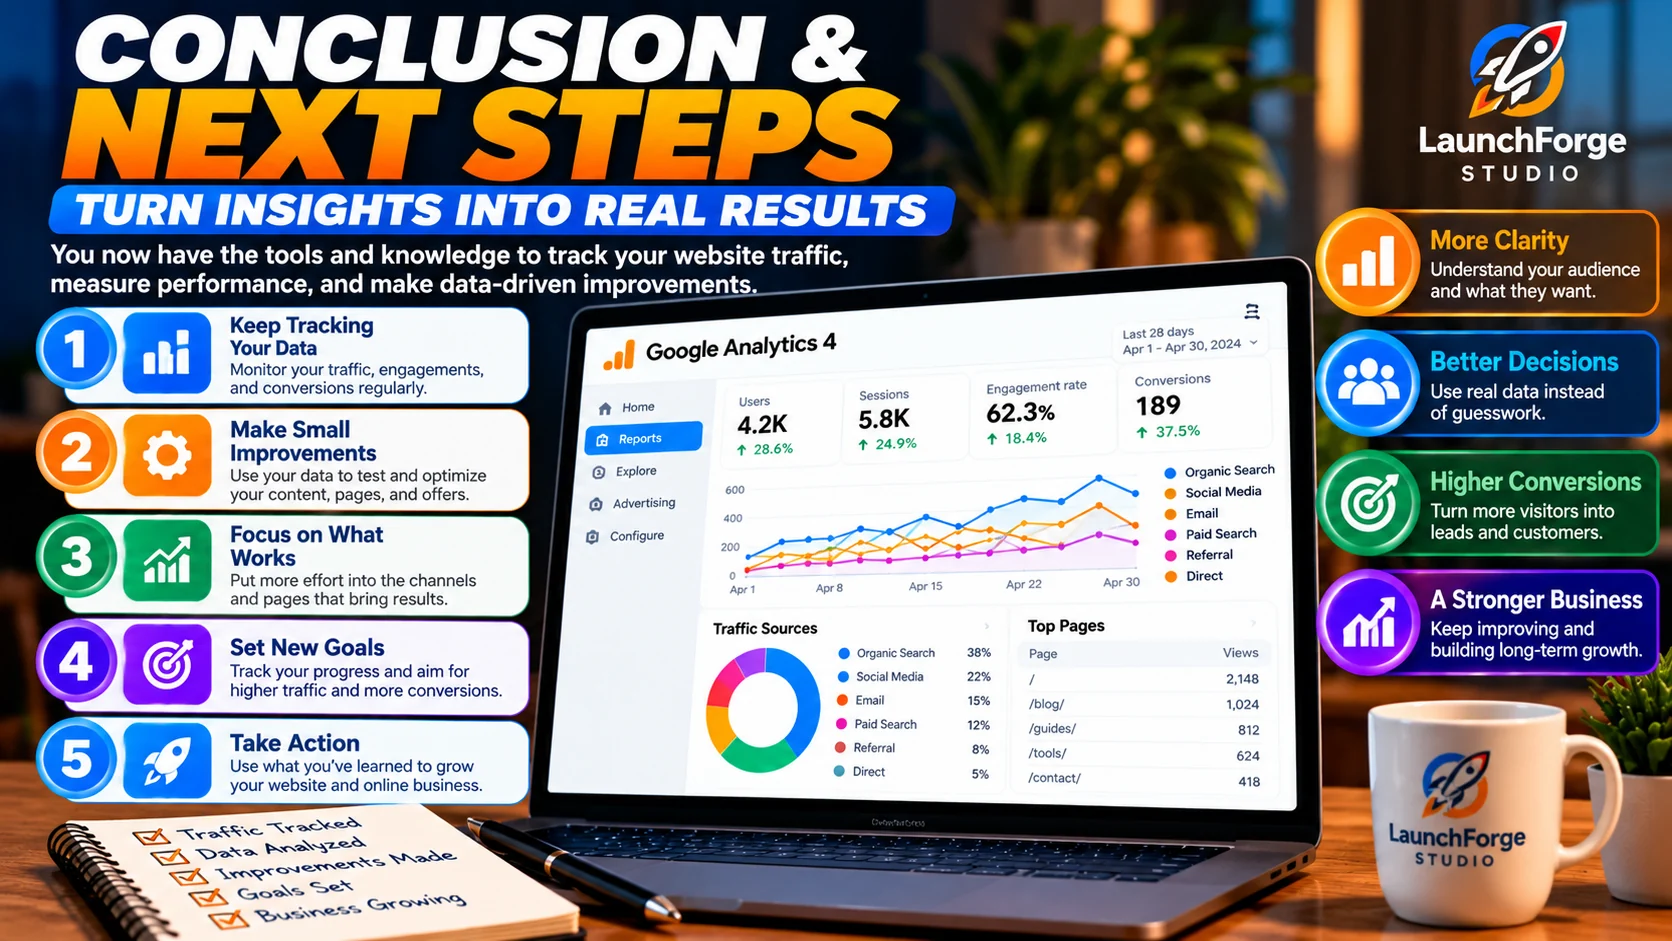
Turn website analytics into meaningful improvements by tracking results, making small changes, and focusing on what works.
Learning how to track website traffic and conversions is one of the most useful skills you can develop when building an online business.
But remember something important.
More traffic doesn’t automatically mean more success.
A website receiving thousands of visitors isn’t necessarily performing better than one attracting a smaller, more interested audience.
What matters is understanding where your visitors come from, how they interact with your content, and whether your website helps them take meaningful next steps.
Google Analytics 4 can help you understand visitor activity and important actions. Google Search Console can help you monitor your visibility in Google Search. Together, these free tools provide a valuable starting point for making informed decisions.
And you don’t need to master every feature overnight.
Start with the basics. Track your traffic, identify your most useful pages, measure a meaningful conversion, and review your progress regularly.
Most importantly, use what you learn to improve the experience you’re creating for your visitors.
Build with purpose. Measure what matters. Improve one step at a time.
That’s how website analytics becomes more than a collection of numbers. It becomes a practical tool for building a stronger online business.